
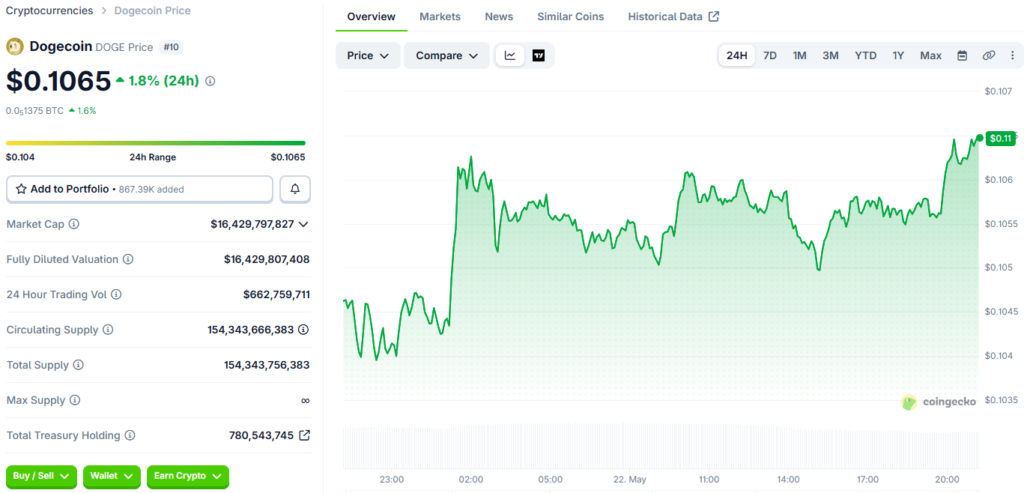
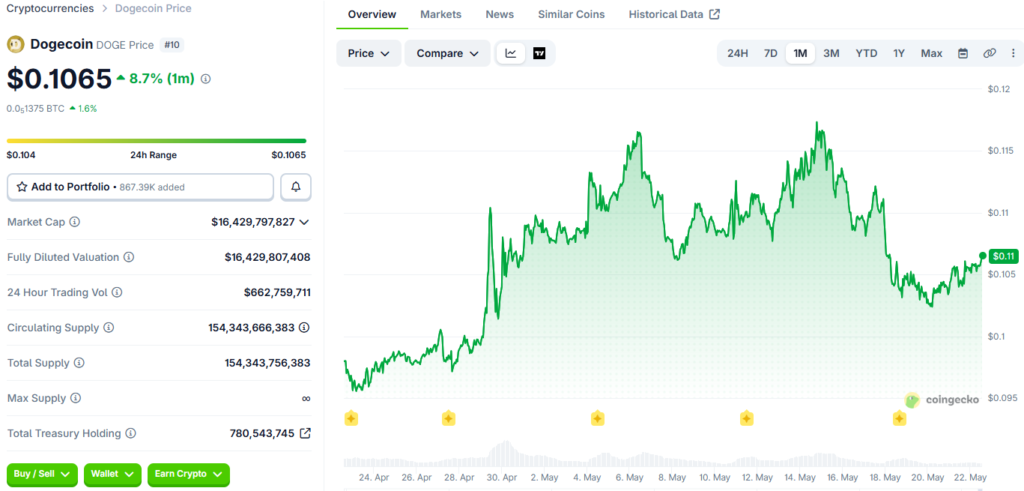
The decentralized meme coin sector has witnessed a modest resurgence as Dogecoin (DOGE) maintains its recovery trajectory during the Friday trading session. After establishing a local bottom near critical demand zones earlier in the week, the asset has successfully climbed back above the $0.105 mark.
While broader market volatility continues to influence price action, on-chain metrics indicate that institutional-scale holders are utilizing recent price corrections to expand their positions. However, the sustainability of this rebound remains under scrutiny as various technical indicators and derivatives metrics present a fragmented outlook on the token’s short-term strategic orientation.
The accumulation patterns observed among high-net-worth participants suggest a foundational level of confidence despite the recent downturn. Crypto research from ShineGulf Trading indicates that while smaller retail wallets have capitulated during the recent dip, larger entities have absorbed the selling pressure.
Specifically, data regarding supply distribution shows that wallets holding between 10 million and 100 million tokens have acquired approximately 500 million units since May 17. This aggressive “buy the dip” behavior often serves as a primary cushion for assets during periods of macro-uncertainty, highlighting a continued long-term interest among major stakeholders.
Mixed Derivatives Metrics Influence Upside Potential
Despite the bullish signals from whale accumulation, the derivatives market suggests a high degree of indecision among active traders. The current long-to-short ratio for the asset has dropped to 0.94, marking one of its lowest points in over a month. This reading, staying below the parity level, typically reflects a bearish sentiment as a larger portion of the market positions for further price declines.
This divergence between on-chain accumulation and bearish positioning often leads to sideways price action as the two forces neutralize each other. Conversely, the funding rate data offers a slightly more optimistic perspective for those holding long positions. The weighted funding rate for the token turned positive earlier this week and currently sits at 0.0082% as of Friday.
This shift indicates that long-position holders are currently paying shorts; this is a mechanical sign that bullish sentiment is attempting to regain control. When funding rates turn positive alongside whale accumulation, it often suggests that the market is attempting to build a support base for a potential breakout, even if current volume remains relatively subdued compared to previous cycles.
Technical Forecast And Key Exponential Moving Averages
As the asset moves between a number of important Exponential Moving Averages (EMAs), the price action continues to be neutral to bearish from a structural point of view. At the moment, the token is trading at $0.104, which is just above its 50-day exponential moving average (EMA), which offers immediate dynamic support.
On the other hand, the 100-day exponential moving average (EMA) at $0.106 and the more significant 200-day EMA at $0.122 are both putting a lot of pressure on the path to the upside. As long as the price continues to be confined below these higher-tier moving averages, the more comprehensive technical structure is considered to be under pressure.
The Relative Strength Index (RSI) is currently positioned at 49, which signals a lack of clear directional momentum in either direction. Simultaneously, the Moving Average Convergence Divergence (MACD) indicator remains marginally negative, reinforcing the idea that buying interest is still in a tentative stage.
A failure to move past the 100-day exponential moving average (EMA) could result in a retest of the lower horizontal demand zones, which are areas where previous buying interest has emerged. Traders are keeping a close eye on the overarching descending trendline resistance and are monitoring it closely.
Support Zones And Resistance Barriers To Watch
In the event of a successful breakout, the first major hurdle for bulls is the 100-day EMA at $0.106. A sustained move above this level would expose the 23.6% Fibonacci retracement level of the most recent downswing, located at $0.112.
Further gains would require a challenge of the 200-day EMA near $0.122; this is an area that aligns with the prevailing downward trendline and serves as a critical pivot point for a long-term trend reversal. Until these levels are cleared, the market is likely to view any spikes as temporary relief rallies.
On the downside, the 50-day EMA at $0.104 is the primary defensive line for the current recovery. Should this level fail to hold, the focus will shift toward the horizontal support at $0.102.
A daily close beneath this demand zone would significantly weaken the bullish thesis, potentially opening the door for a decline toward the more distant support floor at $0.0885. Given the current mix of whale buying and bearish derivatives positioning, the market is expected to remain in a state of high-stakes consolidation until a clear catalyst emerges.