
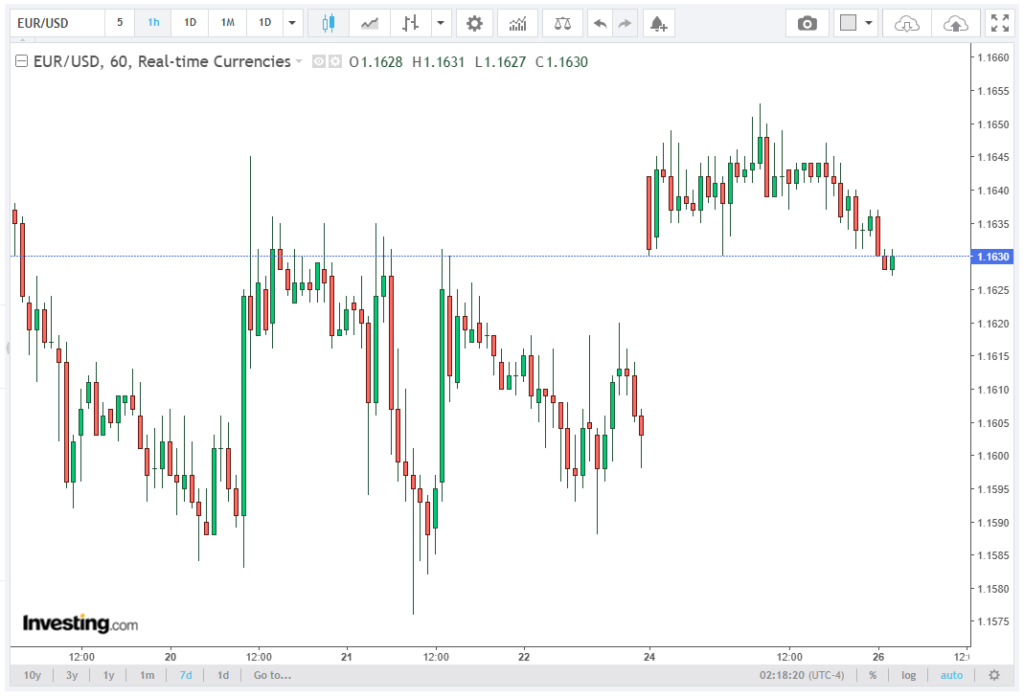
The EUR/USD pair trades marginally lower near 1.1633–1.1635 during the Asian session, maintaining a bearish short-term structure as price action continues to consolidate below key dynamic resistance levels. The brokers at Skytexla recently published an in-depth article covering this topic.
The broader intraday profile reflects a controlled downside drift rather than a sharp impulsive selloff, but the underlying bias remains tilted toward further depreciation as momentum indicators and moving averages continue to weaken.
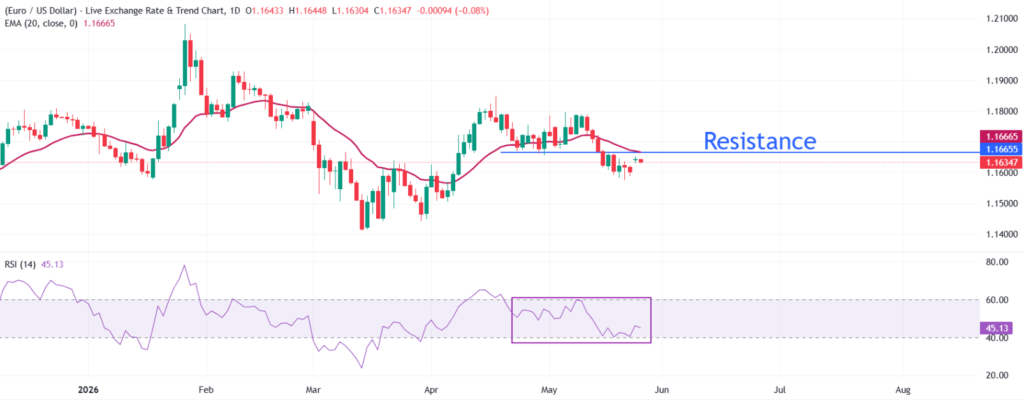
From a technical standpoint, spot remains capped below the 20-day Exponential Moving Average (EMA) at 1.1667, while repeated failures to reclaim this level reinforce the dominance of sellers in the near-term trend structure. The slope of the 20-day EMA has turned decisively lower, indicating that the medium-cycle momentum is transitioning from neutral to bearish.
Price Action and Structural Trend Development
EUR/USD has been in a gradual corrective phase after failing to sustain levels above 1.1800 earlier in the broader monthly structure. Since that rejection, the pair has formed a sequence of lower highs and lower lows, consistent with a developing short-term downtrend channel.
Current trading around 1.1633 places the pair approximately 35–40 pips below the 20-day EMA, reinforcing the bearish alignment between spot price and trend baseline. Intraday volatility remains compressed, with most price oscillations contained within a 1.1600–1.1665 range, indicating consolidation within a downward-leaning structure rather than trend reversal.
The inability of buyers to generate sustained closes above 1.1667 highlights weakening demand at higher levels, while each rebound attempt has been met with progressively lower selling interest thresholds.
Momentum Indicators and Trend Strength
The Relative Strength Index (RSI) is currently positioned near 45.1, reflecting sub-neutral momentum conditions with a slight bearish tilt. This reading is particularly important because it signals that downside momentum is not yet extreme, leaving room for further depreciation without entering oversold territory.
Historically, RSI readings between 40 and 50 during a downtrend often indicate continuation phases rather than exhaustion. In this context, the current RSI structure suggests weakening bullish momentum below 50, a lack of strong accumulation on dips, and continued control by sellers in intraday cycles.
Additionally, the absence of bullish divergence on short-term oscillators supports the view that the current move lower is still in progress rather than nearing completion.
Moving Averages and Dynamic Resistance Structure
The most critical technical constraint remains the 20-day EMA at 1.1667, which is now acting as a firm dynamic resistance ceiling. The downward slope of this EMA confirms that the rolling 20-session average of price is declining, reflecting persistent net selling pressure over the past month.
Price rejection from this level has occurred multiple times, and each failed attempt to reclaim it has resulted in renewed downside continuation toward lower liquidity zones. The separation between spot and the 20-day EMA, currently around 30–40 pips, further emphasizes bearish control.
Below this, the absence of a strong intermediate moving average support on the 4-hour chart leaves price more exposed to downside extensions once key intraday levels break.
Key Technical Levels and Liquidity Zones
On the upside, the immediate resistance remains firmly defined at 1.1667, aligned with the 20-day EMA. A sustained daily close above this level would be required to neutralize the current bearish bias.
However, even in such a scenario, follow-through strength would still need to clear the 1.1700 psychological barrier, which coincides with prior intraday supply zones and short-term distribution clusters.
Without a break above 1.1700, any upside move is likely to be interpreted as corrective rather than a trend reversal.
On the downside, initial support is located at 1.1600, which represents a short-term liquidity pocket where intraday buyers have previously attempted to stabilize the price. A decisive breakdown below this level would expose the May 21 swing low at 1.1576, a structurally important reference point that has defined recent corrective boundaries.
A breach of 1.1576 would significantly strengthen bearish continuation signals and likely trigger an extension toward the broader support region near 1.1500, which represents both a psychological threshold and a historical demand zone.
Outlook: Bearish bias persists below 1.1667
The near-term outlook for EUR/USD remains bearish as long as price holds below the 20-day EMA at 1.1667. The technical configuration continues to favor sellers, with momentum indicators supporting gradual downside continuation rather than reversal.
Failure to reclaim 1.1667 keeps the path of least resistance directed toward 1.1600 and 1.1576, with an extension toward 1.1500 becoming increasingly relevant if downside momentum accelerates.
Until a structural break above 1.1700 occurs, rallies are likely to be treated as corrective retracements within a broader bearish consolidation phase, rather than the beginning of a sustained bullish reversal.