
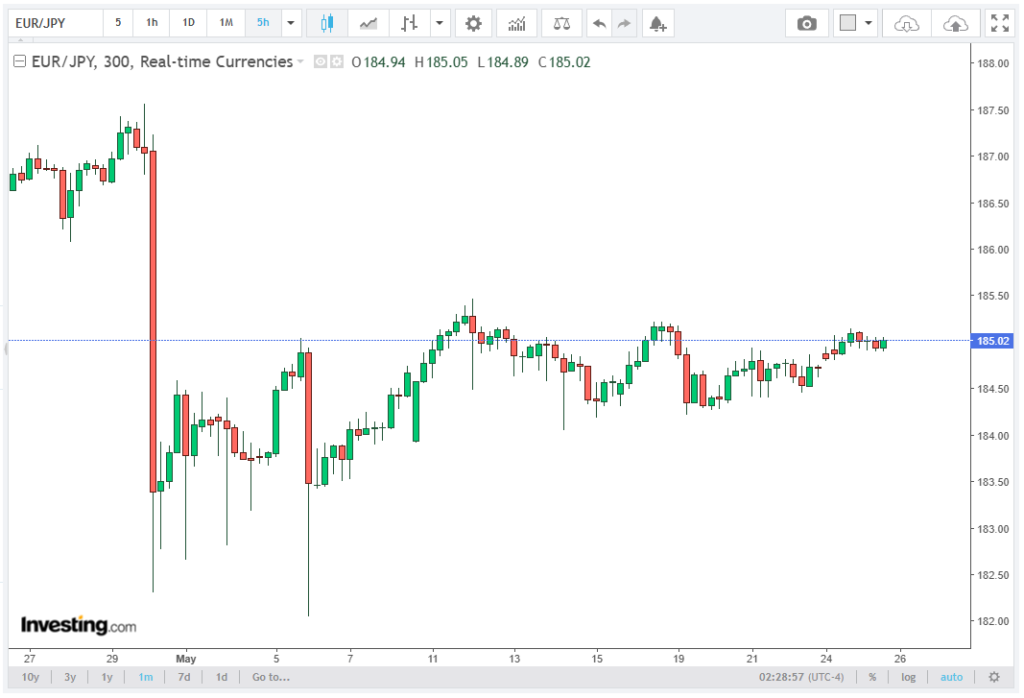
The EUR/JPY currency pair is currently trading in a pivotal technical zone, hovering near 185.00 after a modest intraday pullback following the previous session’s gains.
During Asian trading hours on Tuesday, price action stabilized around 184.90, reflecting a market that remains broadly constructive but increasingly constrained by overhead technical resistance. This topic is examined closely by the brokers at Skytexla in their latest article.
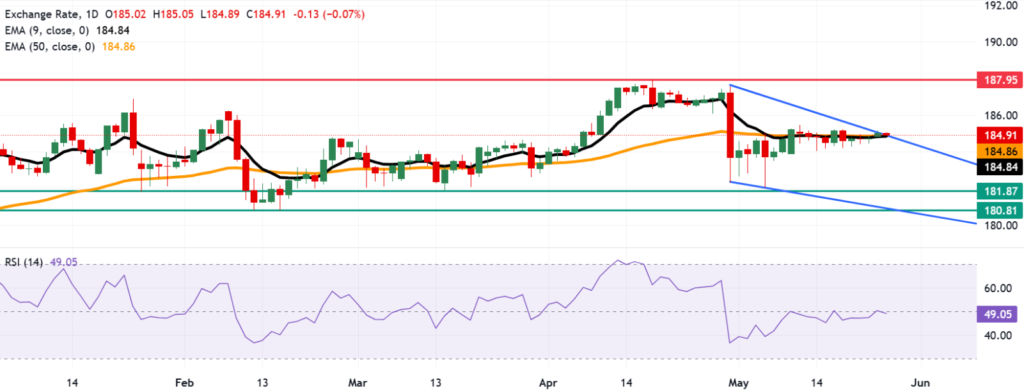
Despite short-term hesitation, the cross continues to exhibit a bullish structural bias, holding above both the nine-day EMA (184.84) and the 50-day EMA (184.86). These closely aligned moving averages just below the psychological 185.00 level suggest that underlying demand remains intact on shallow retracements.
However, price is simultaneously pressing against the upper boundary of a descending channel, signalling a potential inflection point in trend direction.
Technical Structure and Market Positioning
From a broader technical perspective, EUR/JPY is in a transitional phase where bullish momentum is attempting to challenge a medium-term corrective structure. The presence of a descending channel indicates that recent price action has been shaped by lower highs and lower lows, reflecting persistent but gradually weakening downside pressure.
However, current positioning near the channel resistance zone around 185.00 suggests that sellers are losing control at the margin. The fact that price remains above key exponential moving averages reinforces the idea that buyers are defending dips aggressively, preventing deeper retracements.
This structural tension between channel resistance and moving average support defines the current trading environment, making the next directional breakout particularly significant.
Momentum Indicators and RSI Analysis
Momentum signals further highlight a market in equilibrium rather than trending extension. The 14-day Relative Strength Index (RSI) is currently positioned at 49.05, firmly within neutral territory.
This reading is important for several reasons. First, it indicates that momentum has cooled significantly from prior overbought conditions, suggesting that recent upside attempts have lost some strength. Second, the RSI’s midline positioning implies a lack of decisive directional pressure, with neither bulls nor bears currently in full control.
Importantly, the RSI remaining near 50 while price holds above key EMAs suggests consolidation rather than reversal. In technical terms, this often precedes either a breakout continuation or a trend failure, depending on whether resistance or support gives way first.
Key Support and Resistance Levels
On the upside, the immediate resistance zone is defined by the 185.00 psychological level, closely aligned with the upper channel boundary. A clean break above this region would expose higher targets, with the next major resistance situated near the all-time high of 187.95, last recorded on April 17.
This level represents a critical long-term ceiling, and a move toward it would require sustained bullish momentum and supportive macroeconomic conditions.
On the downside, the first layer of support is highly concentrated around the 50-day EMA at 184.86 and the nine-day EMA at 184.84. The tight clustering of these averages creates a technical support confluence zone, reinforcing its importance as a short-term pivot.
A breakdown below this area would signal weakening bullish control and likely trigger a deeper correction. In such a case, attention would shift toward the three-month low at 181.87, recorded on March 16, followed by the five-month low at 180.81, reached on February 12. These levels represent broader structural supports within the medium-term trend.
Outlook and Scenario Development
The outlook for EUR/JPY remains balanced but increasingly sensitive to breakout confirmation signals. The market is effectively coiling between descending channel resistance and clustered EMA support, creating conditions for a volatility expansion phase.
A bullish scenario requires a decisive break above the 185.00 resistance zone and the descending channel top, ideally accompanied by rising RSI momentum above the midline. Such a move would validate a structural shift and open the path toward 187.95, the key historical high.
Conversely, a bearish scenario would emerge if price fails to sustain levels above the 50-day EMA support zone, leading to a breakdown below 184.80–184.86. This would expose downside liquidity pockets and potentially accelerate a decline toward 181.87, with further risk extending to 180.81 if momentum deteriorates.
Conclusion
In summary, EUR/JPY is currently positioned at a technically significant crossroads, trading around 185.00 at the upper boundary of a descending channel. Momentum, as reflected by the RSI at 49.05, remains neutral, while price action continues to respect key EMA support levels at 184.84–184.86.
The market is therefore in a state of compression, where a breakout in either direction could define the next medium-term trend. Traders will closely monitor whether buyers can force a sustained breakout above channel resistance, or whether sellers regain control and drive price back toward deeper structural supports.