
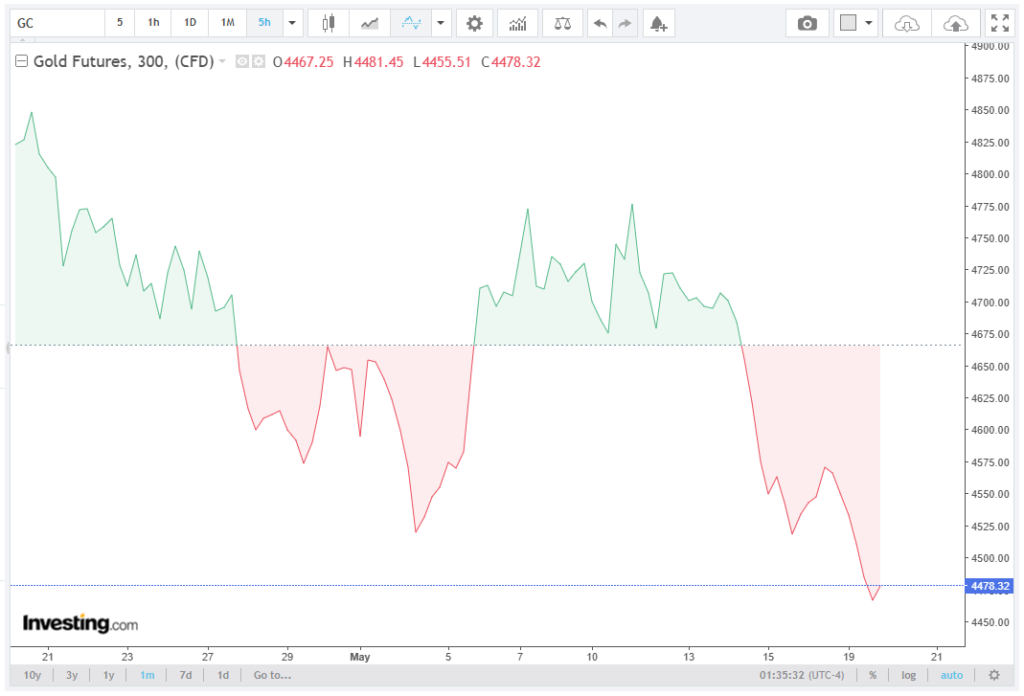
Gold (XAU/USD) remained under pressure during Wednesday’s Asian trading session, hovering near the $4,470 region after touching its weakest level since March 30.
The metal has now declined by more than 3.8% from its recent monthly peak as traders continue to rotate into the US Dollar Index (DXY), which remains close to a six-week high above the 106.40 level. Murrius Group’s brokers explore this subject in depth in their newest article.
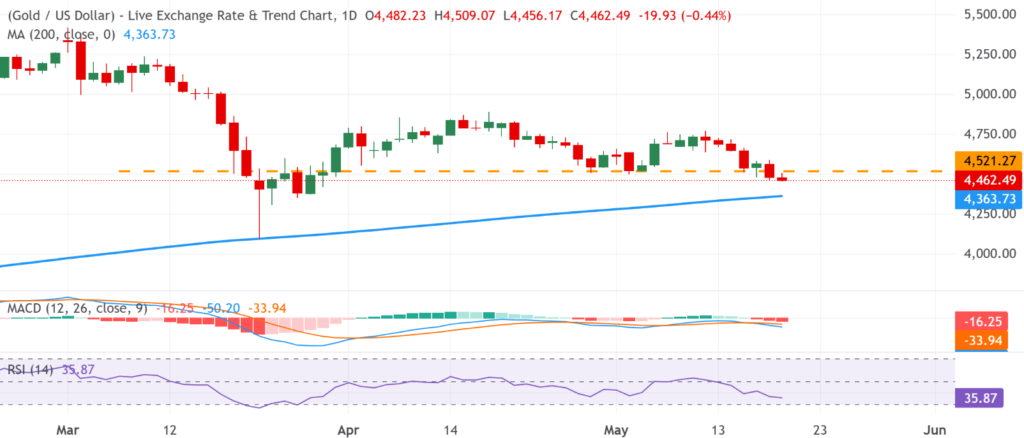
Spot Gold also slipped decisively below the critical $4,500 psychological support level, increasing downside momentum and exposing additional technical selling pressure. Market participants now view the 200-day Simple Moving Average (SMA) near $4,363 as the next major support zone.
Geopolitical Risk Maintains Defensive USD Positioning
Market sentiment remains cautious as negotiations surrounding the US-Iran conflict continue without a definitive breakthrough. Investors remain concerned about unresolved disputes tied to Iran’s nuclear program, regional military positioning, and the security of the Strait of Hormuz, through which roughly 20% of global oil supply passes daily.
Recent comments from senior US officials reinforced fears that military escalation remains possible if diplomatic negotiations fail. Although both sides continue to signal interest in avoiding confrontation, the absence of a finalized agreement has preserved strong defensive positioning in the Dollar.
Under typical market conditions, geopolitical instability tends to support both Gold and the USD simultaneously. However, the current macro backdrop favors the Greenback more aggressively because of rising yield differentials and tighter monetary policy expectations.
The US Dollar Index has gained approximately 1.9% over the last two weeks, while safe-haven demand has increasingly shifted toward short-duration US assets and Treasury markets instead of precious metals.
Oil Strength Reignites Inflation Concerns
Another major driver pressuring Gold is the resilience of Crude Oil prices. WTI crude continues to trade near monthly highs above $84 per barrel, while Brent crude remains elevated near $88 per barrel, reflecting supply disruption fears tied to Middle East tensions.
The rebound in energy prices has complicated the inflation outlook for the Federal Reserve. Higher transportation and input costs risk feeding into broader Consumer Price Index (CPI) readings during the second half of the year, particularly as services inflation already remains sticky.
Recent US inflation data showed core CPI holding above the Fed’s long-term 2% target, while the latest PCE inflation figures remained near 2.8% year-over-year. This persistence has reduced expectations for aggressive monetary easing and increased speculation that rates may stay restrictive well into 2026.
Higher inflation expectations typically increase nominal Treasury yields and strengthen the Dollar, both of which reduce the attractiveness of Gold holdings.
Fed Rate Hike Bets Continue to Rise
Markets are increasingly pricing in the possibility that the Federal Reserve may maintain a hawkish policy bias for longer than previously anticipated. According to interest-rate futures pricing, traders now assign more than a 55% probability of at least one additional 25-basis-point rate increase during 2026.
This repricing has triggered a renewed climb in Treasury yields across the curve. The benchmark 10-year US Treasury yield recently advanced toward 4.62%, while the 2-year yield, which is highly sensitive to monetary policy expectations, remained above 4.95%.
The widening spread between US yields and other developed-market sovereign debt continues to attract capital inflows into Dollar-denominated assets. This environment remains fundamentally bearish for Gold because higher yields increase the opportunity cost of holding non-interest-bearing commodities.
Technical Indicators Continue to Favor Sellers
From a technical perspective, Gold’s structure continues to weaken after failing to reclaim resistance near $4,550 earlier this week.
Momentum oscillators remain aligned with bearish continuation patterns. The Relative Strength Index (RSI) currently trades near 35, indicating deteriorating bullish momentum while remaining above oversold territory.
Meanwhile, the Moving Average Convergence Divergence (MACD) remains below the signal line and firmly in negative territory, confirming sustained downside momentum across short-term timeframes.
The immediate downside target now sits near the 200-day SMA at $4,363. A confirmed break below this long-term trend indicator could accelerate liquidation flows and expose the next support cluster around $4,300–$4,280.
On the upside, initial resistance is now located near $4,500, followed by stronger selling interest around $4,550 and $4,600.
Outlook Remains Bearish in the Near Term
The broader macroeconomic backdrop continues to favor the US Dollar over Gold in the near term. Elevated Treasury yields, persistent inflation pressures, firm energy prices, and geopolitical uncertainty collectively reinforce demand for the Greenback while limiting upside potential in precious metals.
Unless incoming economic data materially weakens or the Federal Reserve signals a softer policy stance, Gold may struggle to sustain meaningful recovery attempts. Current market positioning suggests that rallies are likely to encounter renewed selling pressure, particularly while prices remain below the key $4,500 threshold.