
The AUD/USD pair remains under sustained bearish pressure during Wednesday’s Asian session, trading near 0.7100 after printing a fresh multi-week low at 0.7084, its weakest level since April 14.
The pair has now declined more than 2.6% from the May swing high near 0.7275, reflecting broad-based US Dollar strength and deteriorating risk appetite across global financial markets. In their latest article, Murrius Group brokers provide a detailed analysis of this topic.
Fed Rate Expectations Continue to Support the US Dollar
The US Dollar Index (DXY) remains near a six-week high as traders continue pricing in restrictive Federal Reserve policy conditions. Market participants have aggressively reduced expectations for near-term rate cuts after the recent rebound in commodity and energy prices raised concerns about a renewed inflationary cycle.
Higher oil prices have increased the probability that US CPI inflation could stabilize above the Fed’s 2.0% target for a longer period. As a result, US Treasury yields have moved higher across the curve, with the benchmark 10-year yield holding above 4.40%, providing additional support for the Greenback.
Interest rate futures now imply a lower probability of aggressive easing during the second half of the year, reinforcing USD demand against higher-beta currencies, including the Australian Dollar.
The risk-sensitive AUD also remains vulnerable to broader market uncertainty. Equity market volatility, weaker investor sentiment, and concerns surrounding global growth continue to reduce demand for cyclical currencies, further weighing on AUD/USD.
Technical Breakdown Below 200-Period EMA Reinforces Bearish Structure
From a technical perspective, AUD/USD has entered a more vulnerable short-term phase after breaking below the 200-period Exponential Moving Average (EMA) on the 4-hour timeframe at 0.7153.
The pair also breached the 38.2% Fibonacci retracement level of the March-May rally near 0.7110, confirming a deterioration in bullish momentum. The breakdown triggered additional selling pressure and opened the path toward deeper retracement levels.
The MACD histogram remains negative, while the MACD line continues to trade below both the signal line and the neutral zero threshold, confirming downside momentum acceleration. In addition, bearish divergence observed earlier this week remains active on intraday charts.
Meanwhile, the Relative Strength Index (RSI) has fallen toward 28, entering oversold territory. While this could generate temporary short-covering rebounds, oversold conditions during strong directional trends often persist longer than expected.
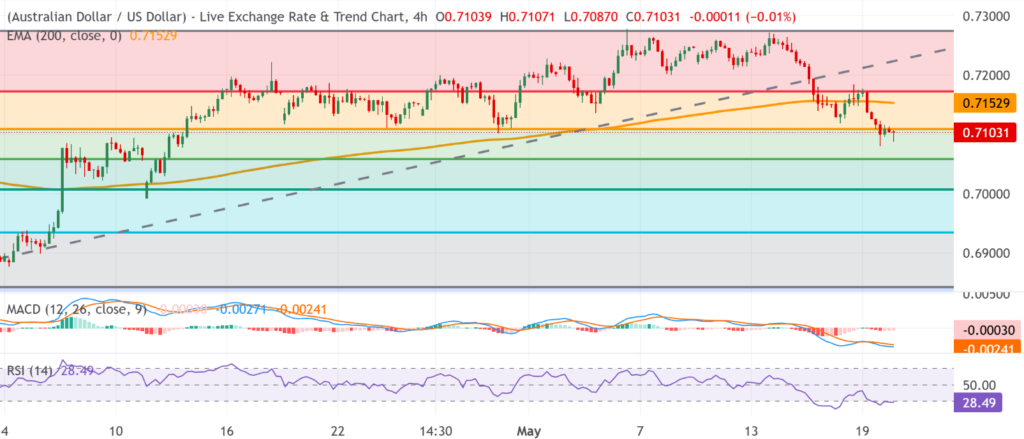
Price action also remains below the descending trendline resistance originating from the 0.7275 peak, maintaining the broader bearish channel structure intact.
Fibonacci Levels Signal Additional Downside Risk
The immediate downside target is located near the 50.0% Fibonacci retracement level at 0.7059. This support zone is critical for short-term market direction, as a sustained break below it could accelerate bearish momentum toward the psychologically important 0.7000 handle.
Below that level, the next major support emerges near the 61.8% Fibonacci retracement at 0.7008. The 61.8% retracement is often viewed as a decisive technical threshold in trending markets, and failure to stabilize above this area could expose deeper structural losses.
Additional downside targets are located at 0.6935 and 0.6843, both representing previous medium-term consolidation zones and historical support clusters from earlier trading cycles.
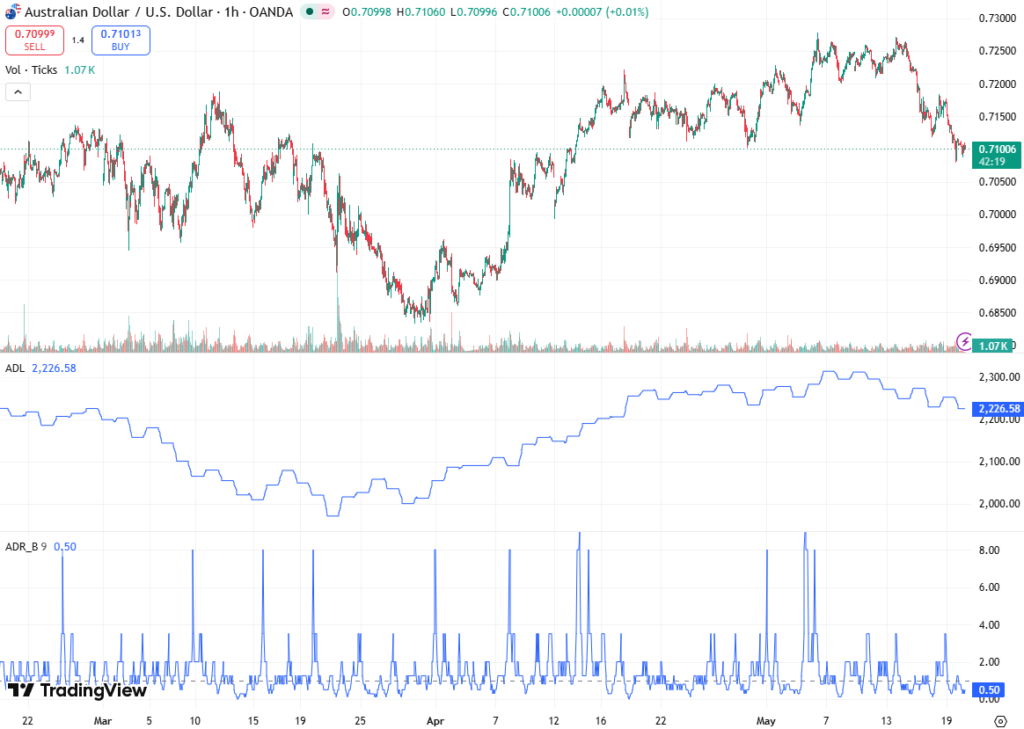
Volume analysis also suggests increasing participation from bearish traders during recent declines, reinforcing the probability of continuation selling if support levels fail to hold.
Resistance Levels Remain Firm
On the upside, AUD/USD faces layered resistance zones that could limit any corrective recovery attempts.
Initial resistance remains positioned at 0.7110, the former 38.2% Fibonacci retracement support that has now turned into resistance. A break above this level would be required to stabilize short-term sentiment.
The next resistance area appears near the 200-period EMA at 0.7153, followed by the 23.6% Fibonacci retracement level at 0.7173. These technical barriers are likely to attract renewed selling interest unless broader USD momentum weakens significantly.
Only a sustained recovery above 0.7200 and eventually 0.7275 would invalidate the current bearish sequence and shift momentum back toward the bulls.
Outlook
The near-term outlook for AUD/USD remains negative as macroeconomic fundamentals and technical indicators continue to favor the US Dollar. Elevated Treasury yields, geopolitical uncertainty, and persistent inflation concerns are likely to maintain upward pressure on the Greenback in the short term.
Technically, the pair remains vulnerable below the 200-period EMA and key Fibonacci resistance levels, while momentum studies continue signaling bearish continuation risks.
Unless AUD/USD can reclaim territory above 0.7150–0.7170, sellers are likely to retain control, with 0.7059 and 0.7008 remaining the next major downside targets in the sessions ahead.