
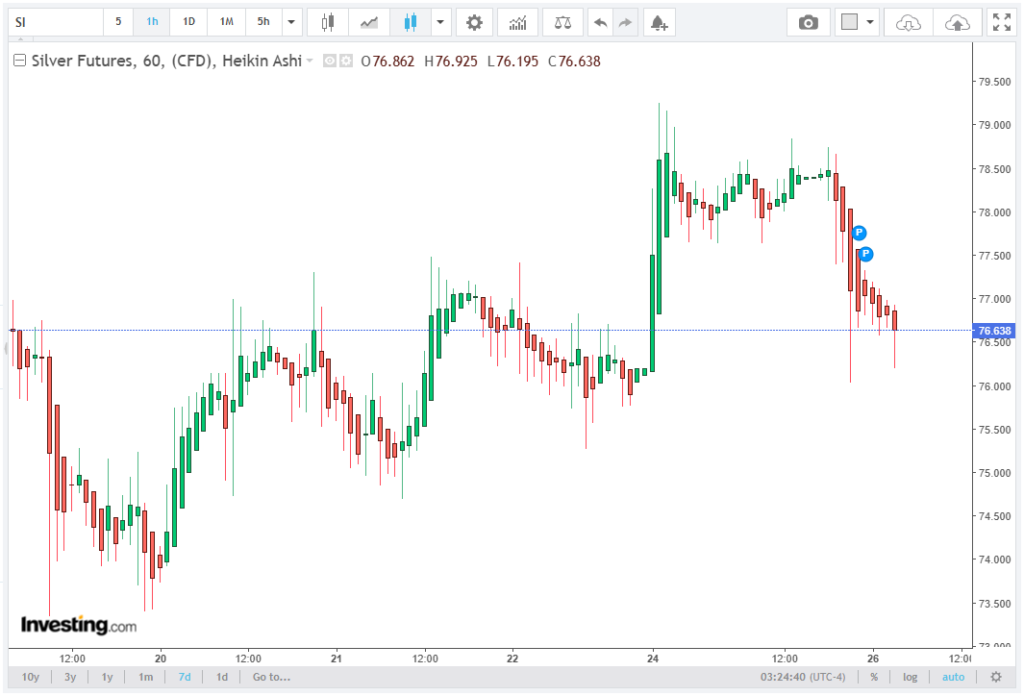
The silver price (XAG/USD) has extended its corrective phase, sliding toward $76.50 in European trading, reflecting a near 2% daily decline. This move follows a four-session rebound that temporarily lifted prices from sub-$74 levels, but the recovery has now been rejected at key technical resistance zones. The brokers at Skytexla share an in-depth analysis of this topic in their recent article.
Market positioning indicates that silver remains trapped within a broader $70.00–$84.00 medium-term range, with volatility compression followed by directional rejection at the upper boundary.
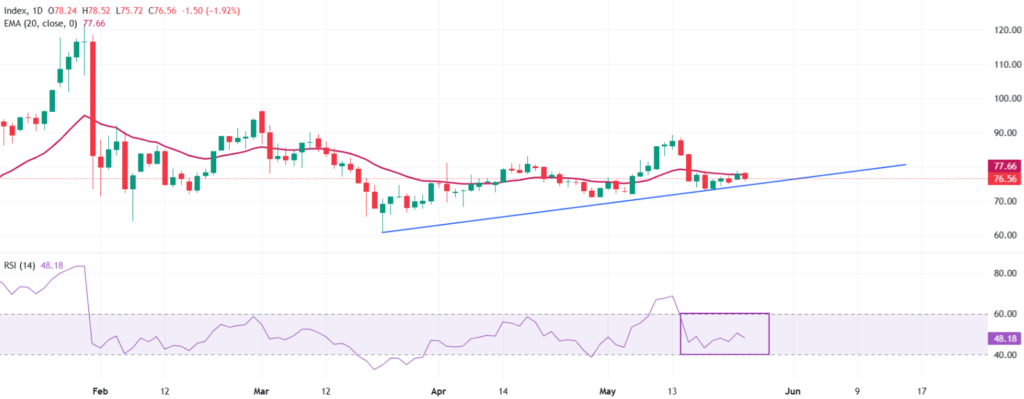
The current move lower is occurring after failure to sustain momentum above the 20-day exponential moving average (EMA) at $77.66, confirming that short-term trend control has shifted back to sellers. Price action is also developing below the 50% Fibonacci retracement zone of the latest upswing from $73.20 to $83.88, reinforcing a bearish retracement structure rather than a trend continuation.
Oil Price Acceleration and Inflation Channel Effects
Crude oil has responded more aggressively than metals, with WTI crude trading near $91.00, representing a 1.5% intraday increase and a continuation of its medium-term bullish channel. From a macro transmission standpoint, oil above the $88–$90 resistance band reintroduces inflation persistence risk into global pricing models.
Energy inflation is particularly relevant for silver due to its dual sensitivity: industrial demand elasticity and monetary policy reaction functions. Historical beta analysis shows that a 10% increase in oil prices typically correlates with a 1.2%–1.8% rise in US CPI expectations over a 3–6 month horizon, depending on demand elasticity conditions.
This inflation repricing has immediate implications for rate expectations and discounting models applied to non-yielding assets such as silver.
Federal Reserve Pricing and Real Yield Expansion
The most structurally important driver behind silver’s weakness remains the adjustment in real yield expectations. Market pricing has shifted toward fewer rate cuts over the next 12 months, with futures curves indicating a flattening of the easing cycle.
As nominal yields stabilize while inflation expectations rise due to energy shocks, real yields (nominal yields minus inflation expectations) remain elevated. This environment historically produces a negative correlation with silver prices of approximately -0.65 to -0.80, depending on macro regime classification.
Silver, as a non-yielding asset, tends to underperform when real yields exceed +1.5%, a threshold currently being approached in US short-end rates. This dynamic reduces speculative demand and increases opportunity cost for holding bullion positions.
Technical Structure: Breakdown of Short-Term Trend Integrity
At the time of analysis, XAG/USD trades near $76.56, below both its 20-day EMA ($77.66) and 5-day VWAP, indicating intraday and swing momentum divergence. The failure to hold above these reference levels confirms a distribution phase following the recent rally.
Momentum indicators reinforce this view. The Relative Strength Index (RSI 14) is positioned within the 40–60 neutral band, but with a downward slope from prior overbought conditions near 68. This suggests fading bullish momentum rather than oversold reversal conditions.
Volatility expansion is also beginning to re-emerge, with the ATR (Average True Range) increasing by approximately 6% week-on-week, indicating that directional movement is resuming after a consolidation phase.
Key Price Levels and Structural Thresholds
On the upside, the immediate resistance cluster is concentrated between $77.50 and $77.90, anchored by the 20-day EMA and prior intraday supply rejection zones. A sustained break above this range would be required to re-establish bullish momentum, with follow-through targets extending toward $80.20, followed by the major swing high at $83.88, which represents a prior liquidity pool and breakout failure zone.
On the downside, the most critical structural support lies at $75.90–$76.00, corresponding to a rising short-term trend line and recent consolidation base. A confirmed daily close below this zone would invalidate the current higher-low formation and expose downside liquidity pockets.
Below this breakdown level, price discovery would likely accelerate toward $73.20, which marks the origin of the most recent impulsive rally. A deeper extension would open structural risk toward the $70.00 psychological support zone, which aligns with prior accumulation demand and long-term value positioning levels.
Outlook: Range Expansion with Bearish Bias
The broader technical and macro framework suggests silver remains in a distribution-to-correction phase, with downside bias prevailing unless price reclaims the $77.66 EMA threshold with strong volume confirmation.
Energy-driven inflation pressures are reinforcing expectations of tighter monetary conditions, while geopolitical risk is shifting capital flows toward oil rather than precious metals. This asymmetric reaction is weakening silver’s traditional safe-haven bid.
Unless macro conditions pivot toward lower real yields or renewed USD softness, XAG/USD remains exposed to further downside volatility, with probability-weighted scenarios favoring a retest of $75.90 support, followed by potential extension toward $73.20 and $70.00 in a sustained risk-off breakdown regime.