
The GBP/USD pair trades with a mildly negative bias during Tuesday’s Asian session, retreating from the recent 1.3520-1.3530 resistance zone after posting a one-and-a-half-week high above the 1.3500 psychological barrier.
Spot prices currently fluctuate near 1.3485, down roughly 0.12% on the day, as renewed demand for the US Dollar Index (DXY) offsets the broader bullish structure visible across short-term technical charts. Skytexla’s brokers break down this topic in depth in their newest article.
The latest downside pressure emerges amid a rebound in the greenback following heightened geopolitical tensions in the Middle East and a renewed rise in US Treasury yields.
The move higher in yields reflects persistent market expectations that the Federal Reserve could maintain restrictive monetary policy conditions for longer, particularly as inflation remains above the central bank’s medium-term target.
Even with the intraday pullback, the broader technical configuration for GBP/USD continues to support further upside. The pair remains positioned above several key dynamic and Fibonacci support levels, while momentum oscillators continue to print in positive territory across the 4-hour timeframe.
Technical Structure Maintains Bullish Bias
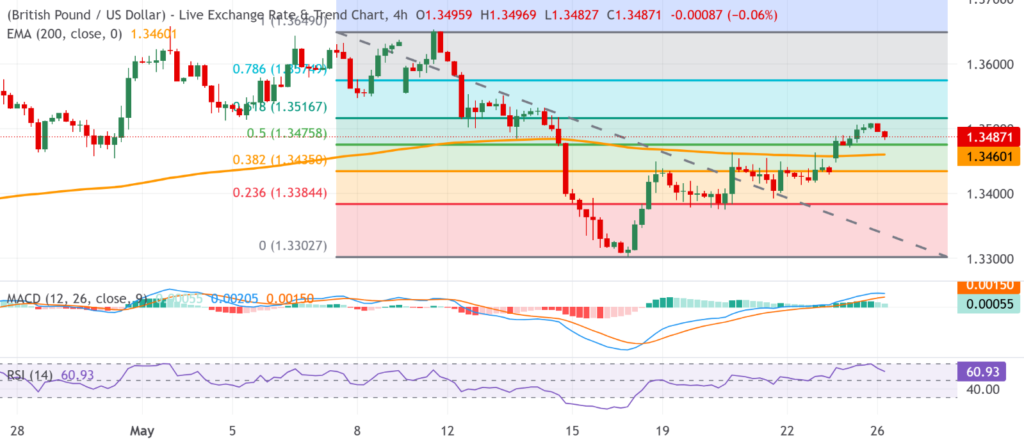
Despite the latest retracement, the technical outlook remains constructive, as GBP/USD continues to hold above the 200-period Exponential Moving Average (EMA) on the 4-hour chart, which is currently positioned near 1.3460. The pair also sustains price action above the 50.0% Fibonacci retracement level at 1.3476, measured from the monthly swing high toward the recent corrective low.
The preservation of these technical levels indicates that bullish market participants still maintain near-term control.
Momentum studies reinforce the positive structure. The Relative Strength Index (RSI) on the 4-hour timeframe remains close to 61, comfortably above the neutral 50 threshold and well below overbought territory near 70. This suggests that upside momentum remains intact without signaling exhaustion.
In addition, the Moving Average Convergence Divergence (MACD) indicator continues to print positive histogram values above the signal line, confirming ongoing bullish momentum development. The slope of the MACD remains moderately positive, indicating that buyers continue to dominate despite temporary corrective price action.
The broader ascending structure from the recent swing low near 1.3300 also remains technically valid as long as prices continue trading above the 200-period EMA support cluster.
Key Resistance Levels Remain in Focus
On the upside, immediate resistance is now located near the 61.8% Fibonacci retracement level at 1.3517. A sustained move above this barrier would likely trigger renewed bullish momentum and expose higher resistance zones.
Beyond 1.3517, the next technical target emerges near the 78.6% Fibonacci retracement at 1.3575. This area represents a significant medium-term supply region and could act as a temporary barrier before a possible extension toward the recent swing high at 1.3649.
A decisive break above 1.3649 would strengthen the broader bullish continuation scenario and potentially open the path toward the 1.3700 handle, followed by the longer-term resistance zone near 1.3740-1.3760.
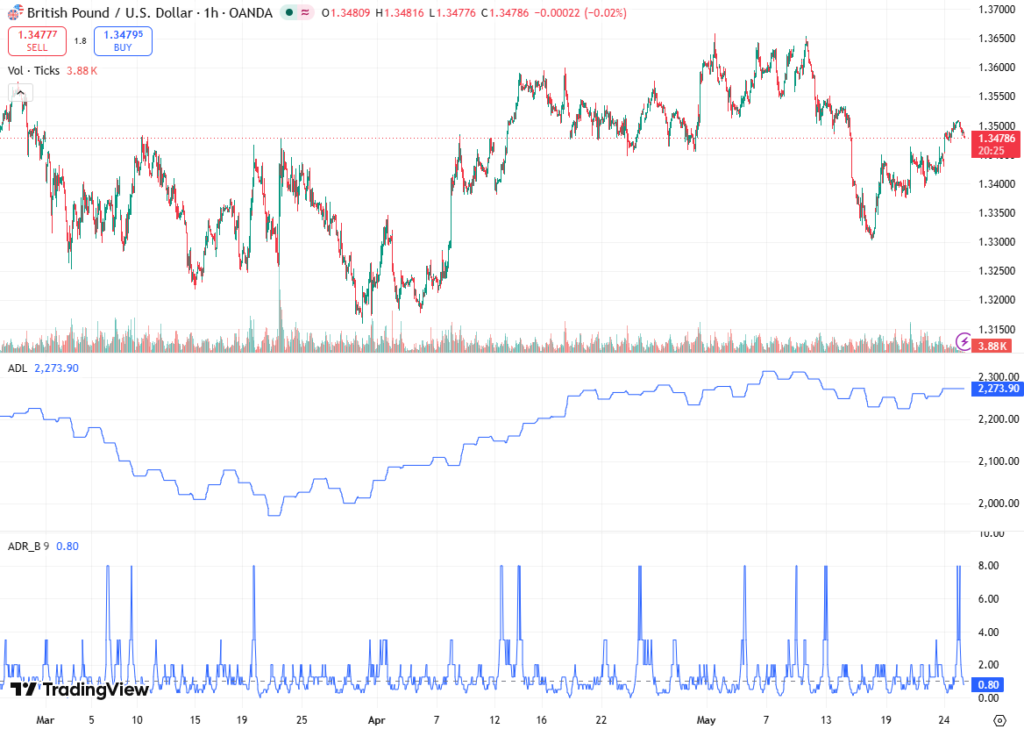
Volume dynamics also support the bullish case. Recent upside sessions showed improving participation rates, suggesting that institutional buying interest remains active during intraday dips.
Support Levels Could Attract Fresh Buyers
On the downside, initial support remains positioned near 1.3476, which coincides with the midpoint Fibonacci retracement level. Additional technical protection appears near the 200-period EMA at 1.3460, an area likely to attract renewed dip-buying activity from short-term momentum traders.
If bearish pressure intensifies below 1.3460, the next downside target emerges near the 38.2% Fibonacci retracement level at 1.3435. A sustained break beneath this zone could expose deeper correction levels around 1.3384, followed by the major structural support near 1.3303.
However, given the current alignment of trend indicators and momentum oscillators, downside risks appear limited unless the pair closes decisively below the 1.3430-1.3460 support band.
Outlook
The near-term outlook for GBP/USD remains cautiously bullish despite the pair’s inability to sustain gains above 1.3500 during Tuesday’s session. Stronger US Dollar demand, driven by geopolitical uncertainty and elevated Treasury yields, has triggered a modest retracement from recent highs.
Nevertheless, the pair continues to trade above critical technical support levels, including the 200-period EMA, the 50.0% Fibonacci retracement, and the broader ascending channel support structure visible on intraday charts.
As long as GBP/USD maintains stability above the 1.3435-1.3460 support region, bullish momentum is expected to remain intact. A successful recovery above 1.3517 could accelerate gains toward 1.3575 and potentially the 1.3649 resistance zone in the sessions ahead.
For now, short-term weakness appears corrective rather than trend-defining, with the broader technical setup continuing to favor additional upside attempts once USD strength begins to stabilize.