
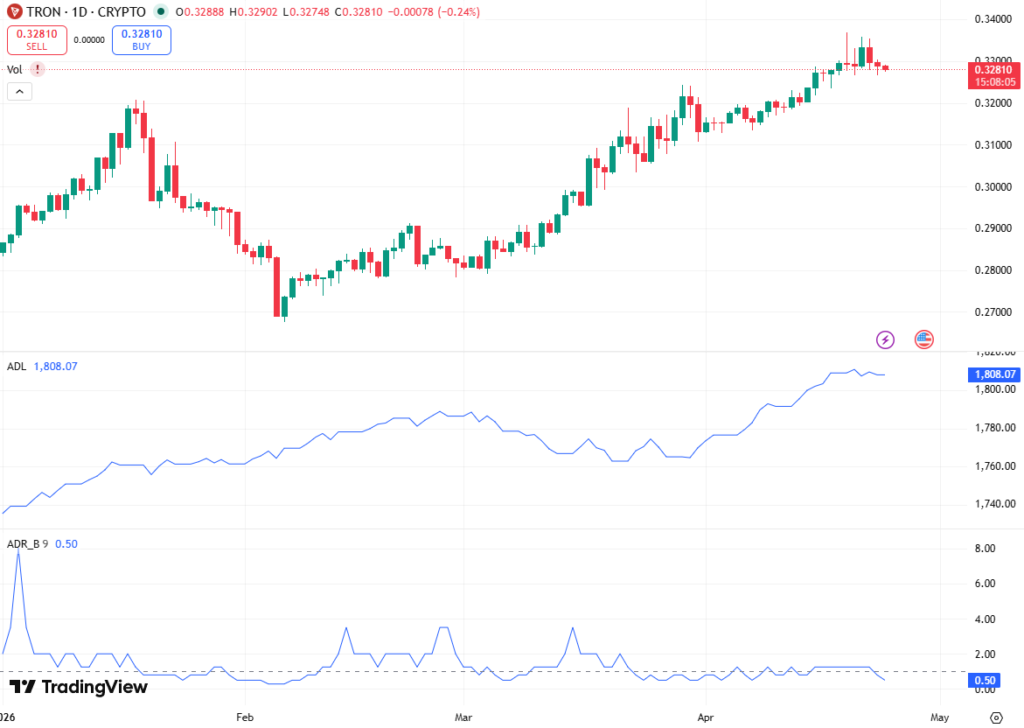
TRON (TRX) is currently exhibiting early signs of a technical pullback after failing to sustain momentum near recent highs. The broader market structure suggests that while accumulation remains steady in the background, short-term price action is being dominated by a rising volatility regime. Kixy has published an article that offers a comprehensive and accessible explanation of this topic.
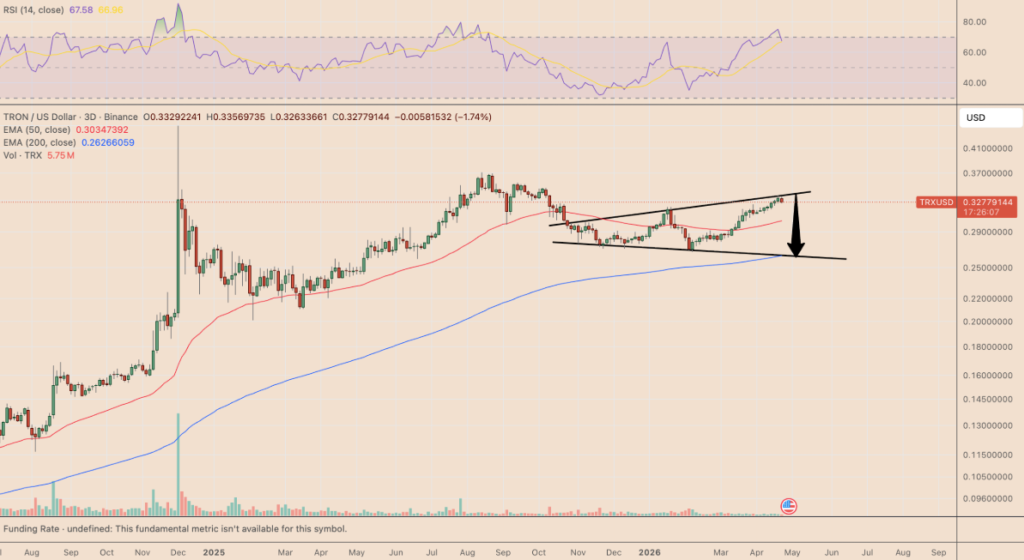
On higher timeframes, particularly the 3-day chart, TRX is forming a broadening megaphone pattern, a structure often associated with unstable price expansion and eventual directional breakdown.
Recent rejection near the $0.34 resistance zone has shifted sentiment toward caution, as buyers struggle to maintain control above key mid-range levels. With momentum indicators cooling and structure weakening, the probability of a move toward lower support zones, especially around $0.26, is increasing. This level is not arbitrary; it aligns with both historical demand and a major technical indicator cluster.
Megaphone Pattern Signals Expanding Volatility
On the 3-day TRX/USD chart, price action is clearly defined by a megaphone (broadening wedge) formation, where successive highs and lows expand outward. This structure reflects increasing market indecision, often driven by alternating phases of aggressive buying and selling.
In TRX’s case, the upper boundary near $0.34 has acted as a strong resistance ceiling, rejecting the price multiple times. Each rejection reinforces the idea that buyers are losing momentum at higher levels. Meanwhile, the lower boundary continues to descend toward the mid-$0.20s, suggesting a potential convergence zone where liquidity could accumulate.
Technically, megaphone patterns are considered high-volatility reversal structures. They rarely resolve in a continuation without first testing the opposite boundary. Given TRX’s latest rejection, probability is now tilting toward a rotation toward the lower trendline support, with $0.26 emerging as the first critical downside target.
Key Resistance Rejection and Downside Price Levels
The rejection at $0.34 is particularly significant because it represents a failed breakout attempt above a psychologically important level. Price action has since started to drift downward, signaling that bullish momentum is fading.
The immediate downside structure places $0.29 support as the first key defense zone. A decisive breakdown below $0.29 would likely accelerate selling pressure and confirm that the recent rally has entered a corrective phase.
Below this level, attention shifts toward $0.26, which acts as both a structural support zone and a technical confluence area. Historically, this region has absorbed liquidity during prior consolidation phases, making it a high-probability reaccumulation or reversal zone.
If bearish momentum extends further, the full measured move from the megaphone structure suggests a potential extension toward the $0.21–$0.22 range, representing a deeper correction scenario of roughly 20% downside risk from current levels.
Technical Indicators Confirm Weakening Momentum
Momentum indicators are increasingly aligning with the bearish structural outlook. The Relative Strength Index (RSI) has started to roll over from overbought territory, indicating that buying pressure is fading after an extended upward move.
This RSI downturn is critical because it often precedes short-term corrective phases, especially when paired with resistance rejection at major supply zones like $0.34.
In addition, the 200-period Exponential Moving Average (EMA) on the 3-day chart is converging near the $0.26 support zone. This creates a strong technical confluence, where dynamic trend support aligns with horizontal demand.
Breakdown Scenario and 20% Correction Risk
If TRX fails to hold $0.29 support, the probability of accelerated downside increases significantly. In technical terms, this level acts as a pivot trigger zone. A breakdown would likely activate stop-loss clusters and algorithmic selling pressure.
Using a standard measured move projection from the megaphone pattern, analysts typically estimate the vertical height of the structure and project it downward from the breakdown point. Applying this methodology to TRX suggests a downside extension toward $0.21–$0.22, which aligns with a full ~20% correction scenario from current price levels.
Such a move would not necessarily invalidate the broader long-term trend, but it would represent a meaningful short-term reset, potentially resetting leverage and restoring equilibrium in the market structure.
Conclusion: Short-Term Weakness vs Long-Term Accumulation
In summary, TRX is at a technical inflection point, where short-term chart structure is increasingly bearish despite ongoing accumulation from institutional players. The presence of a megaphone pattern, combined with rejection at $0.34 resistance, rising volatility, and weakening momentum indicators, all point toward a potential 20% correction scenario.
The key level to watch remains $0.29, as a breakdown there would likely accelerate moves toward $0.26, with extended risk toward $0.21–$0.22 if selling pressure intensifies. However, strong underlying accumulation by entities such as Tron Inc. suggests that any downside move could ultimately be part of a broader reaccumulation phase rather than a structural reversal.
For now, TRX remains a market defined by tension between technical fragility and fundamental accumulation strength, with volatility likely to remain elevated in the sessions ahead.