
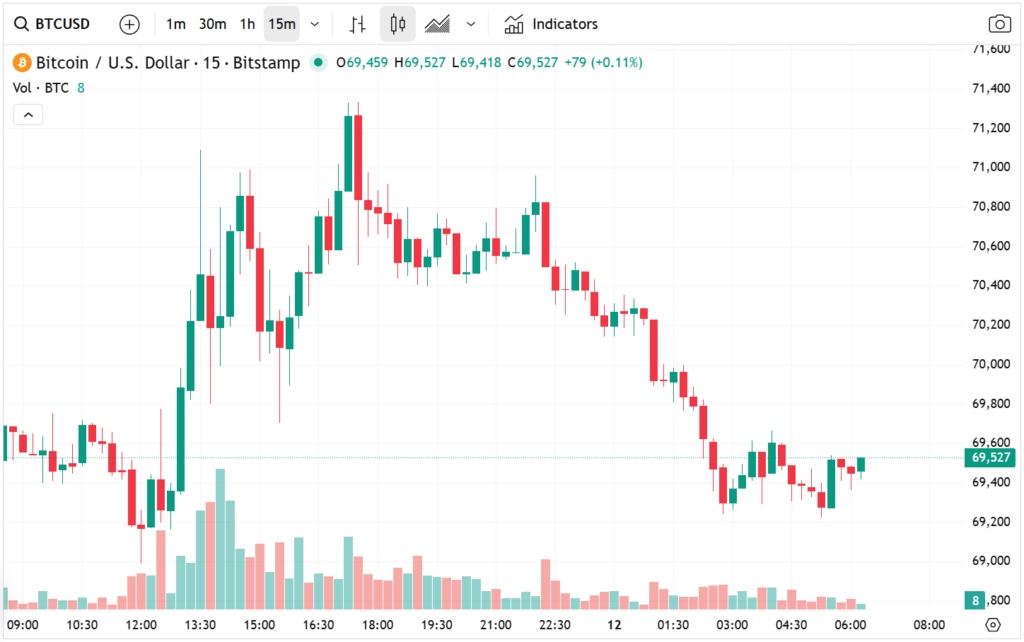
The Bitcoin price remained remarkably resilient on Wednesday, holding firmly above the critical resistance level of $70,000 despite persistent geopolitical uncertainty. The BTC/USD pair was trading at approximately $70,100, representing a significant recovery from the year-to-date low near $60,000 recorded earlier this year.
This steady performance highlights the growing institutional demand and strengthening market confidence in the world’s largest cryptocurrency. In this article, the brokers at EPIQUI present a detailed explanation of this subject.
While global markets continue to grapple with the effects of the ongoing conflict involving Iran, Bitcoin has demonstrated a notable ability to maintain upward momentum. Investors increasingly view Bitcoin as a macro-sensitive digital asset, reacting not only to crypto-specific developments but also to broader economic and geopolitical conditions.
The current price stability above $70K is widely interpreted as a bullish technical signal, indicating that buyers remain firmly in control of the market.
The resilience of the BTC/USD exchange rate suggests that market participants are positioning themselves for further upside, especially as macroeconomic conditions begin to improve. Traders are closely watching key catalysts that could potentially drive Bitcoin toward the next psychological milestone at $75,000.
Falling Oil Prices Support the Bullish Bitcoin Narrative
A major macroeconomic factor supporting the recent Bitcoin rally is the decline in global energy prices. Both Brent crude and West Texas Intermediate (WTI) oil benchmarks have experienced notable pullbacks, falling to approximately $88 and $83 per barrel, respectively. This decline comes after the International Energy Agency (IEA) announced plans for a significant strategic oil reserve release aimed at stabilizing energy markets.
According to the IEA, member countries intend to release over 182 million barrels of oil in the near term. This initiative represents one of the largest coordinated releases of strategic reserves in recent years. The move is designed to ease supply pressures and reduce energy-driven inflation, which has been a persistent concern across global economies.
Lower energy costs are widely regarded as bullish for risk assets, including cryptocurrencies like Bitcoin. When oil prices decline, the pressure on consumer inflation tends to ease. Lower inflation expectations can create a more favorable environment for monetary policy stability, which in turn benefits speculative and growth-oriented assets.
Upcoming U.S. Inflation Data Could Drive the Next Move
Another major event that traders are watching closely is the upcoming U.S. Consumer Price Index (CPI) report. Inflation data remains one of the most important indicators influencing financial market expectations and central bank policy.
Economists surveyed by Reuters expect the headline CPI inflation rate to increase by approximately 2.4% in February, while the core CPI figure, which excludes volatile food and energy prices, is forecast to rise 2.5%.
If the inflation figures come in below expectations, it could reinforce the narrative that price pressures are easing, potentially supporting risk assets including Bitcoin. Conversely, a higher-than-expected inflation reading could temporarily pressure the market by raising concerns about tighter monetary policy conditions.
For the BTC/USD pair, the CPI release may serve as a short-term volatility trigger, potentially determining whether Bitcoin can sustain its move above $70,000.
BTC/USD Technical Analysis Signals Further Upside
From a technical analysis perspective, Bitcoin’s price structure remains decisively bullish. The daily chart shows that the BTC/USD pair has staged a strong rebound, climbing from the year-to-date low of $60,100 to the current level near $70,100.
One of the most important patterns currently forming is an ascending triangle formation, which is widely regarded as a continuation pattern that typically signals potential upward breakouts. This pattern is characterized by a horizontal resistance level near $70,000 combined with higher lows, indicating consistent accumulation by buyers.
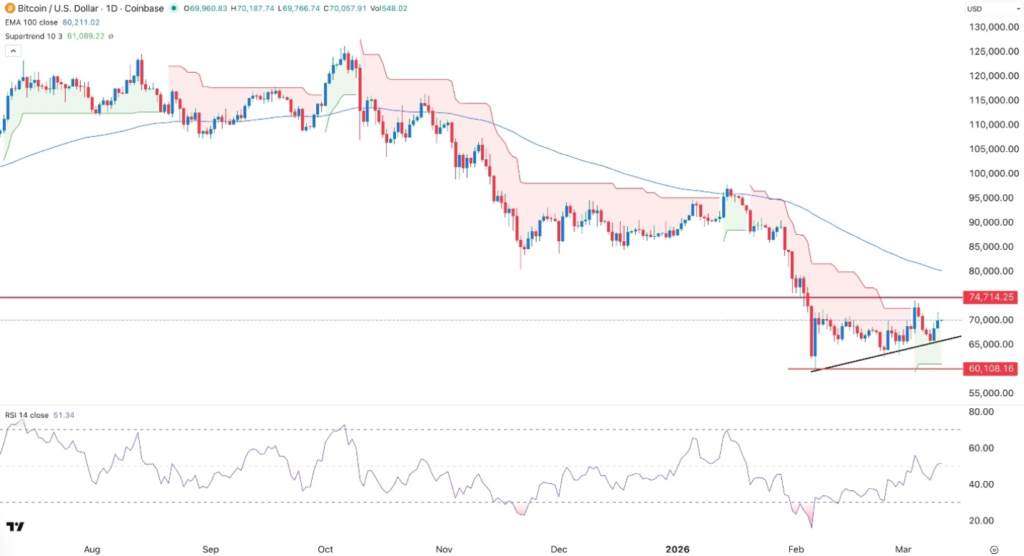
Additional technical indicators further support the bullish outlook. The Supertrend indicator has recently flipped from red to green, confirming a shift in market momentum toward buyers.
Meanwhile, the Relative Strength Index (RSI) has recovered dramatically from an oversold level of 16 to around 51, suggesting that selling pressure has significantly diminished while momentum continues to build.
Bullish Outlook: $75,000 Becomes the Next Major Target
Given the combination of improving macroeconomic conditions, strong ETF inflows, and bullish technical indicators, the outlook for BTC/USD remains positive in the short to medium term.
If Bitcoin successfully breaks above the key resistance zone around $74,700, it would likely trigger a fresh wave of buying momentum. Such a breakout could quickly propel the cryptocurrency toward the next psychological milestone at $75,000.
For traders and investors alike, the $75K level represents a crucial technical and psychological barrier. A sustained move above this threshold would further reinforce the long-term bullish trend that has characterized Bitcoin’s performance in recent years.