
Markets spent years using “stagflation” as a worst-case scenario term without seriously pricing it in. That is changing fast. As of March 16, 2026, the combination of surging energy prices, a weakening labor market, and stubborn inflation has pushed the world out of theoretical territory and into active market conversation. Brokers atNoxi Rise have been tracking how institutional investors are adjusting their portfolio strategies in response, and the positioning shifts are significant.
Stagflation is defined as the simultaneous occurrence of rising inflation and slowing economic growth. It is the scenario central banks dread most because the standard tools for fighting inflation and stimulating growth pull in opposite directions.
The Data Points That Are Building the Case
The January employment revisions were severe. Net job gains for 2025 were revised down from 584,000 to just 181,000, a reduction of nearly 70%. That is not a rounding error. It represents a fundamental reassessment of how strong the labor market actually was throughout last year.
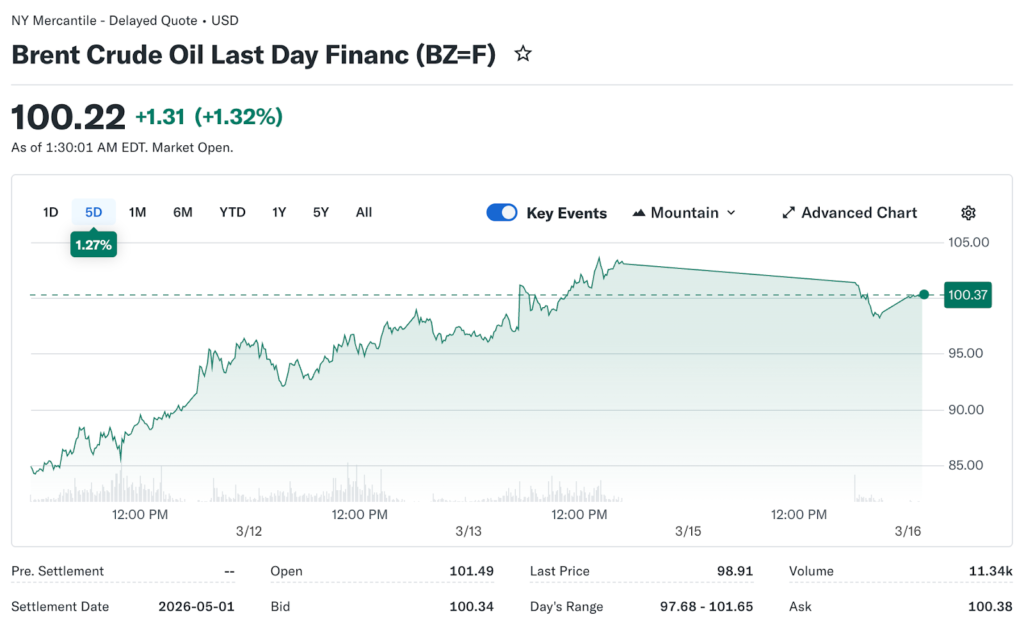
Energy prices have moved aggressively in the other direction. Brent crude posted week-to-date gains of more than 11% through the week ending March 14. WTI briefly spiked to $119 per barrel before retreating. Goldman Sachs has warned that rising energy costs tied to the Middle East conflict could reduce global GDP by 0.3% and increase headline inflation by up to 0.6% if sustained.
Together, those two data sets paint the stagflation picture. Weakening growth and employment on one side. Rising energy-driven inflation, on the other hand.
Why This Cycle Is More Complicated Than 2022
The 2022 comparison gets raised frequently, and it is partially valid. Brent crude exceeded $120 per barrel in 2022 following the Russian invasion of Ukraine, inflation surged, and the Fed responded with aggressive rate hikes that crushed both equities and bonds simultaneously.
But the current setup has meaningful differences. In 2022, the labor market was hot when the oil shock hit. Employers were still hiring aggressively, and consumer spending had momentum. In 2026, the oil shock is landing on a labor market that was already softening before the conflict began. That combination is harder for policy to manage.
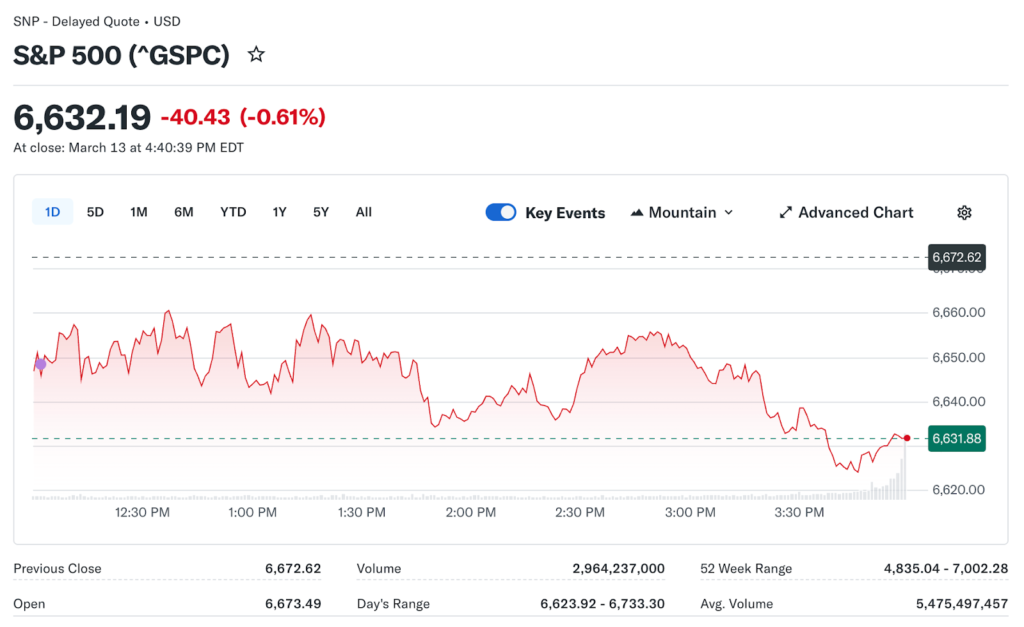
The S&P 500 fell more than 40% during the 1973-74 stagflation episode triggered by the OPEC oil crisis, according to Capital Economics. That historical precedent is not a direct template for today’s environment, but it is informing how experienced risk managers are thinking about downside scenarios.
What the Consumer Sentiment Data Is Showing
March 13 brought another data point that deserves more attention than it received. The University of Michigan’s monthly sentiment reading landed at 55.5, slipping 1.9% below the February figure. That number alone does not tell the full story. The more revealing detail sits inside the methodology.
Respondents surveyed before the Iran military strikes recorded improving sentiment from the prior month. The group surveyed in the nine days after the escalation told the opposite story. Their responses were weak enough to cancel out all prior gains entirely. Two groups, same survey period, completely different readings, separated only by a single geopolitical event.
That split matters for how businesses interpret the data. Consumer spending drives roughly 70% of US GDP, so a rapid confidence reversal of this kind signals that household behavior is adjusting in real time, not just on paper. Companies that track these surveys when planning hiring and capital expenditure will take note.
On inflation expectations, the survey returned mixed signals. The one-year outlook held at 3.4%, unchanged from February. The five-year reading edged down slightly to 3.2%. Taken together, those figures point to a consumer base that expects inflation to linger but not spiral. That reading aligns with an energy-driven price environment rather than a self-reinforcing wage-price feedback loop.
The Sectors That Benefit and the Ones That Don’t
In classic stagflation environments, energy, commodities, utilities, and consumer staples tend to outperform. The current market behavior is consistent with that pattern. Energy is the top-performing S&P 500 sector year to date. Utilities and consumer staples have both outperformed the broader index since the conflict began.
The sectors under greatest pressure are growth stocks, financial technology, and credit-sensitive industries. Higher inflation expectations without rate cuts keep borrowing costs elevated. Companies that relied on cheap financing for expansion find their business models under strain. Software giants have been among the weakest performers, with Adobe falling 7.6% and other major tech names consistently losing ground.
The Policy Box That Has No Clean Exit
Noxi Rise brokers note that the Federal Reserve’s position this week is genuinely constrained in a way that has not been true for several years. The central bank cannot cut rates aggressively without risking a further inflation acceleration. It cannot raise rates without deepening the labor market softness already showing in the data.
The most likely path is continued patience dressed up as data dependency. But patience has a cost when consumer and business confidence is actively deteriorating. The FOMC meeting on Wednesday will not solve the underlying problem. It will simply reveal how clearly the Fed acknowledges it exists.