
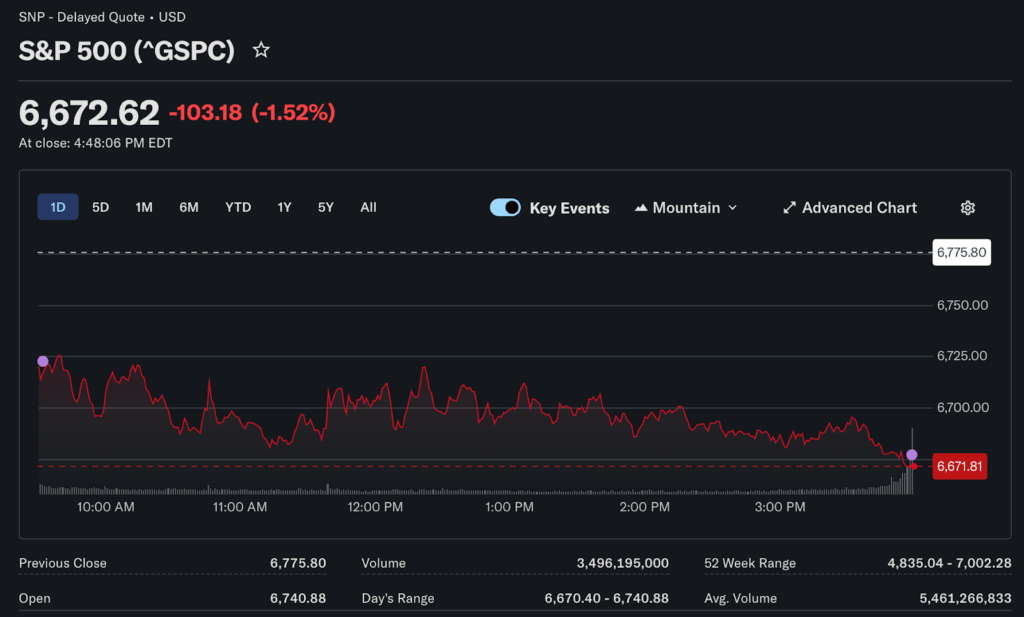
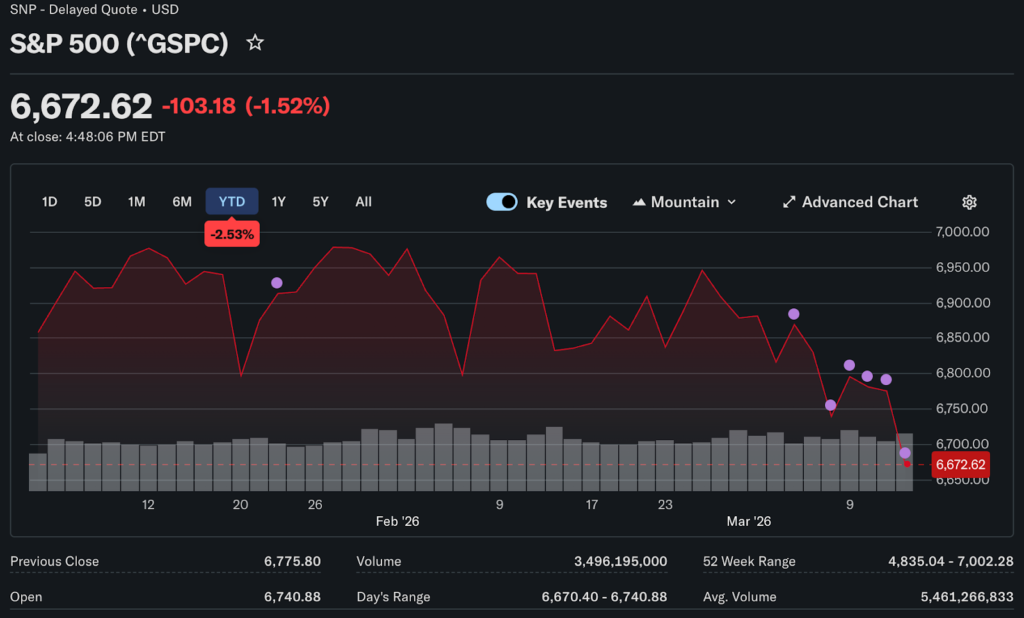
Every major oil supply disruption of the past four decades left a distinct mark on equity markets, and none played out the same way twice. With the S&P 500 sitting roughly 4% below its January record as Brent crude settles at $100, the natural impulse is to reach for a historical comparison.
Financial analyst at TibiPro examines the three most relevant supply shocks of the modern era, what each one did to markets, and why the current episode borrows something from each without mapping cleanly onto any of them.
1990: The Cleanest Parallel
Iraq’s invasion of Kuwait in August 1990 sent oil prices surging and equity markets into a short, sharp decline. The S&P 500 dropped approximately 16% over three months, a move that felt severe at the time but proved temporary. Saudi Arabia stepped up production to replace a significant portion of the lost Kuwaiti supply, which shortened the disruption window considerably. Once the military conflict concluded, oil prices retreated, and equities recovered within roughly six months of their trough.
The episode shows what a geographically contained oil shock looks like when the supply system has enough flexibility to compensate. Once coalition forces concluded operations, the diplomatic picture clarified quickly, and markets could price a recovery. The Federal Reserve also had room to cut rates into the slowdown, which meaningfully softened the economic blow.
2022: The Stagflation Complication
Russia’s move into Ukraine in early 2022 arrived in a global economy already running hot. Supply chain inflation was elevated, central banks had been slow to respond, and labor markets were historically tight. The oil disruption was not creating inflation from scratch; it was amplifying pressures that already existed across the system.
The result was a peak-to-trough decline of roughly 24% in the S&P 500 through 2022, the index’s worst annual performance since 2008. The Federal Reserve raised rates aggressively, which was the right response to demand-driven inflation but an uncomfortable one for equities priced on the assumption of easy money. Markets eventually stabilized and recovered strongly through 2023, but the path involved considerably more pain than the 1990 episode.
2008: A Warning Rather Than a Forecast
Oil reached $147 per barrel in the summer of 2008, reversing violently when the global financial crisis collapsed demand. The S&P 500 fell approximately 57% peak to trough, but oil was a supporting actor rather than the lead cause. Financial leverage unwinding across banks and consumer balance sheets simultaneously was the central driver.
The current market does not carry the same systemic fragility. Bank balance sheets are better capitalized, and no subprime-style credit bubble is inflating across the consumer sector. The element worth noting is the AI infrastructure buildout, where significant debt has accumulated across hyperscalers and data center operators. That debt grows more sensitive to higher borrowing costs if the oil shock keeps yields elevated longer than expected.
What Is Different About 2026
The current episode shares structural features with 1990, but is happening in a more complicated macro environment. In 1990, the Fed had plenty of room to ease. Rates sat at 3.50%-3.75% coming into this disruption, after three cuts in late 2025, and futures markets have already pushed back rate cut expectations substantially. Only one full cut is now priced for 2026, down from two before the conflict escalated.
Continuing jobless claims fell 21,000 to 1.85 million in the most recent reading, a healthy number in isolation. But the multi-month trend has been a gradual softening, which reduces the economy’s buffer against a sustained energy cost increase. In 1990, a tight labor market gave consumers and businesses more cushion. That cushion is thinner now.
The Variable That Matters Most
Looking across all three historical episodes, the factor with the clearest relationship to market recovery speed was not the size of the oil price spike or the initial equity decline. It was how quickly the supply disruption was resolved. When oil markets normalized quickly, equities followed quickly. When the disruption dragged on, the pressure on markets extended accordingly.
Iran’s president put forward a framework anchored by demands for reparations and security guarantees. The US President has described military operations as nearing completion. The gap between those positions remains wide, and no formal agreement has materialized. Investors who believe resolution is weeks away should study the 1990 recovery arc. Those who believe it runs longer need to take the 2022 experience more seriously.
What the Record Actually Supports
Markets recovered after all three of the oil shocks examined here, including the worst one in 2008. The record does not support a structural bear market conclusion, provided the financial system holds together, and no second-order credit crisis emerges from the private credit stress currently unfolding.
What it does support is continued volatility tied directly to conflict news flow. That environment favors disciplined positioning over reactive trading, and it argues for tracking the Strait of Hormuz far more carefully than the next CPI release.