
Treasury yields climbed sharply on Thursday as the bond market processed what equity markets were already feeling: that a sustained oil price shock changes the inflation calculus in ways that monetary policy cannot easily address. The benchmark 10-year Treasury yield rose more than 5 basis points to 4.261%, while the 30-year bond yield added more than 2 basis points to 4.879%.
The 2-year note yield jumped more than 9 basis points to reach 3.734%. Senior broker at TibiPro explains why Thursday’s yield moves tell a more complete story about what markets are pricing than any single data point from this week.
What the Yield Curve Is Saying
The yield curve steepened on Thursday, with short-term yields rising faster than long-term yields on an intraday basis before both moved higher in the afternoon. The 10-year yield at 4.26% represents its highest level since early February, when the conflict in the Middle East was only beginning to take shape in markets.
The 10-year Treasury yield is often called the world’s most important interest rate because it serves as the discount rate for virtually all long-dated asset valuations, from stocks to real estate to infrastructure projects. When that rate moves up by 5-plus basis points in a single session, it reprices a meaningful portion of every risk asset in the market simultaneously.
Oil Is Driving Bond Yields, Not Demand
There is an important distinction worth making about what is pushing yields higher. In a typical economic expansion, rising yields reflect stronger growth expectations and demand-driven inflation. In this environment, the move is different. Bondholders are demanding a higher inflation premium specifically because oil prices have surged, not because the economy is overheating.
That distinction matters for how the Federal Reserve responds. The Fed can cool demand-driven inflation by raising rates. It cannot cool supply-driven inflation from an oil shock with rate hikes without creating unnecessary economic damage. The bond market’s pricing on Thursday reflects a “higher for longer” scenario, not because the Fed wants rates high, but because inflation expectations have shifted in a way that forces yields to reprice independently of what the central bank actually does.
The Mortgage Rate Consequence
The move in long-term Treasury yields had an immediate consequence for the housing market. The average rate on a standard 30-year fixed mortgage jumped to 6.11% in the week ending March 12, according to a Freddie Mac survey of lenders. That was the biggest weekly increase since the Liberation Day tariff episode in April of last year, when bond yields spiked on fiscal concerns.
For home buyers, it comes on top of a market already struggling with affordability. The spring selling season, which typically benefits from improved mortgage access, is now starting against a backdrop of rising rather than falling borrowing costs.
Rate Cut Expectations Have Evaporated
As recently as early March, futures markets were pricing two Federal Reserve rate cuts in 2026. As of Thursday, market expectations have shifted dramatically. Futures markets now imply only one full rate cut in 2026, with roughly a 50% probability of a second. That repricing represents a complete reversal of the sentiment that had been building since the Fed cut rates three times in late 2025.
The CME FedWatch tool shows that the probability of a summer rate cut has dropped sharply. Markets are now pricing a “higher for longer” stance that could extend into September 2026 or beyond, depending on how the oil shock resolves. Each additional week that Brent crude holds above $100 makes that timeline longer, not shorter.
The Bear Steepening and What It Means for Equities
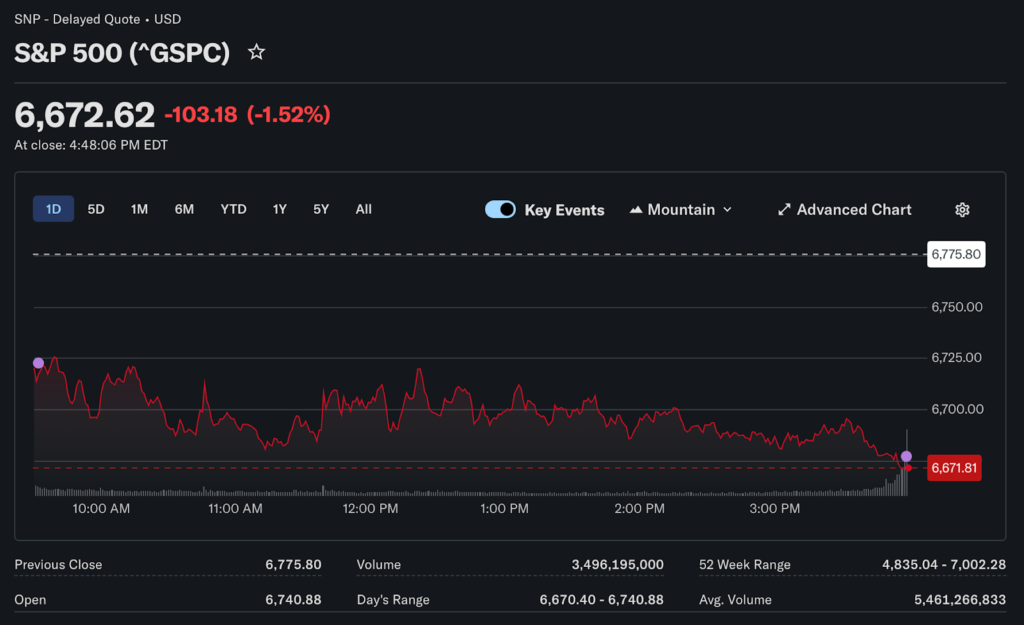
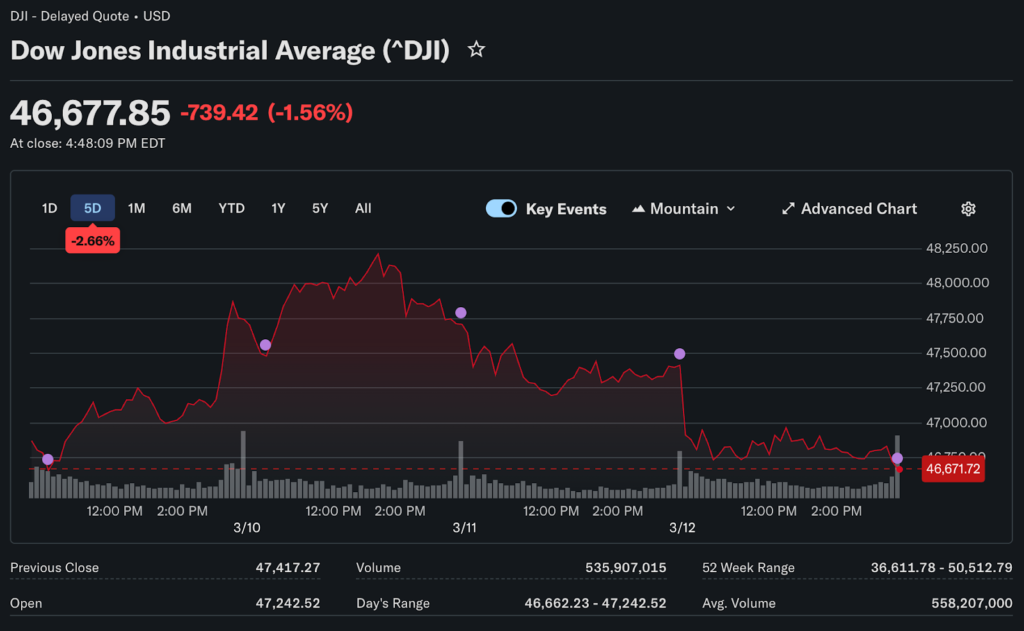
The steepening yield curve, where long-term rates rise faster than short-term rates in a so-called bear steepening, creates specific pressures on equity valuations. Growth stocks that depend on low discount rates to justify high price-to-earnings multiples face the most direct mathematical headwind. That explains why the Nasdaq shed 1.78% on Thursday, slightly more than the Dow’s 1.56% loss, despite both indexes closing sharply lower.
High valuations in technology stocks were already a concern before this week. The S&P 500 CAPE ratio had been running near 37, in the top 10% of historical readings. A higher risk-free rate compresses those multiples from two directions simultaneously: higher discount rates reduce the present value of future earnings, while higher inflation erodes confidence in the real value of those earnings.
What Friday’s PCE Data Could Change
January’s PCE price index, the Federal Reserve’s preferred inflation gauge, is due for release on Friday. Economists project headline and core PCE to come in around 2.9% annually. Like the February CPI, this PCE reading was compiled before the oil shock and will not reflect the inflationary impact of the past two weeks.
The Fed’s March 18 policy meeting will be closely watched for any updated language around the balance of risks. A Fed that acknowledges the oil shock without pre-committing to either direction would be consistent with the cautious data-dependent posture it has maintained throughout 2026.