
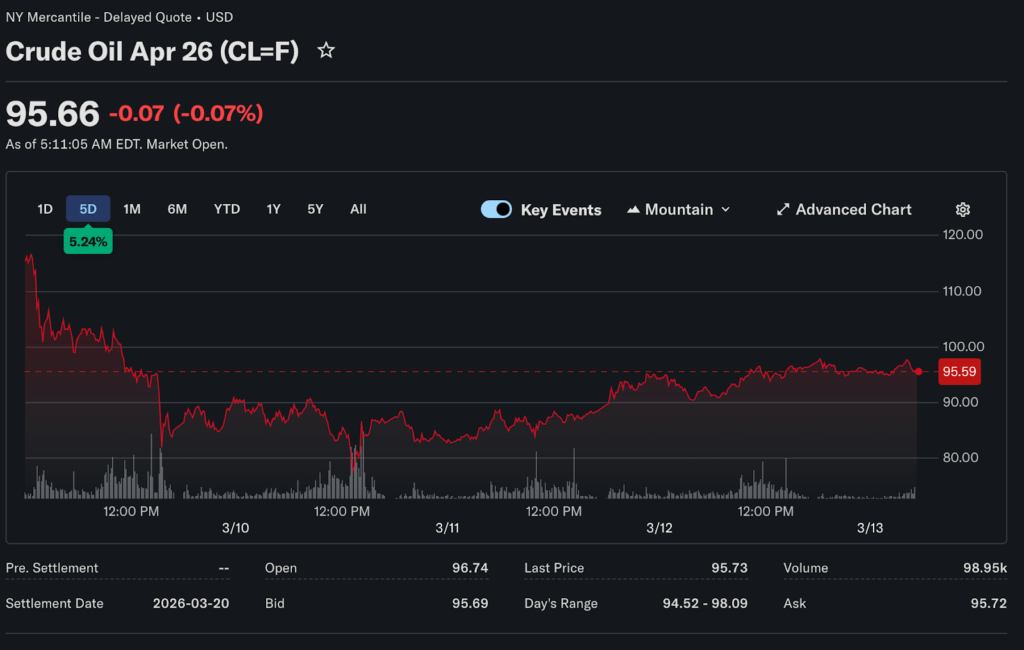
For the first time since August 2022, Brent crude closed above $100 per barrel. Thursday’s settlement at $100.46 came alongside a 9.72% surge in WTI futures to $95.73, a single-session move that forced portfolio managers across every asset class to rethink their risk assumptions. TibiPro‘s lead financial expert points out that the price level alone is not the story worth watching here. The reason Brent is where it is, and how long it stays there, is what actually determines where markets go from here.
The Statement That Moved the Market
Oil’s Thursday surge was not driven by a supply report or production data. It came from Iranian state television, reading out a statement attributed to Mojtaba Khamenei, the country’s newly appointed supreme leader, declaring the Strait of Hormuz closure a deliberate “tool of pressure” against adversaries. That language shifted the market interpretation of the disruption from incidental to intentional.
There is a meaningful difference between a shipping lane being dangerous because of active fighting and a shipping lane being kept closed as a stated policy objective. The first scenario has a natural endpoint when hostilities ease. The second implies that reopening becomes a negotiating chip, which extends the expected duration of the disruption and pushes the long end of the oil price forward curve significantly higher.
The Scale Is Unlike Anything in the Modern Record
The IEA’s monthly oil report, released the same day, described the ongoing situation as the largest supply disruption in the recorded history of global oil markets, with an estimated 7.5% of world supply affected. The share of disrupted exports is even higher.
That figure places the current episode above every previous benchmark. The 1973 Arab oil embargo cut roughly 7% of global supply and reshaped energy policy for a generation. No prior event in the IEA’s data has matched the current scale, and what it implies for price trajectories and policy responses is still being worked out in real time.
Emergency Reserves Were Not Enough
Thursday also brought news of a coordinated IEA emergency stockpile release totaling 400 million barrels, the largest such action in the agency’s history. Crude prices continued rising regardless. That failure to move sentiment is worth examining because it tells investors something about how the market is sizing up the disruption.
With global consumption running near 103 million barrels per day, a 400-million-barrel release spread across a drawdown window provides a buffer measured in days, not weeks. Markets are pricing for a structural shift in supply availability with no clear resolution date, and no reserve release can change that assessment.
Why 2022 Is Only a Partial Comparison
When oil exceeded $100 three years ago following Russia’s invasion of Ukraine, the conditions surrounding that move were fundamentally different. Supply chain inflation was already running hot, pandemic-era stimulus had pushed demand well above trend, and the central bank was operating behind the curve on tightening. An energy shock on top of that backdrop amplified existing pressures rather than creating new ones.
The 2026 situation starts from a different place. Core inflation had been running at 2.5% before the conflict escalated, the Fed had already cut rates to 3.50%-3.75%, and the labor market was in a clearly softer phase than in 2022. The oil shock is arriving in an economy that was not overheating.
Energy Equities as the Countertrend Trade
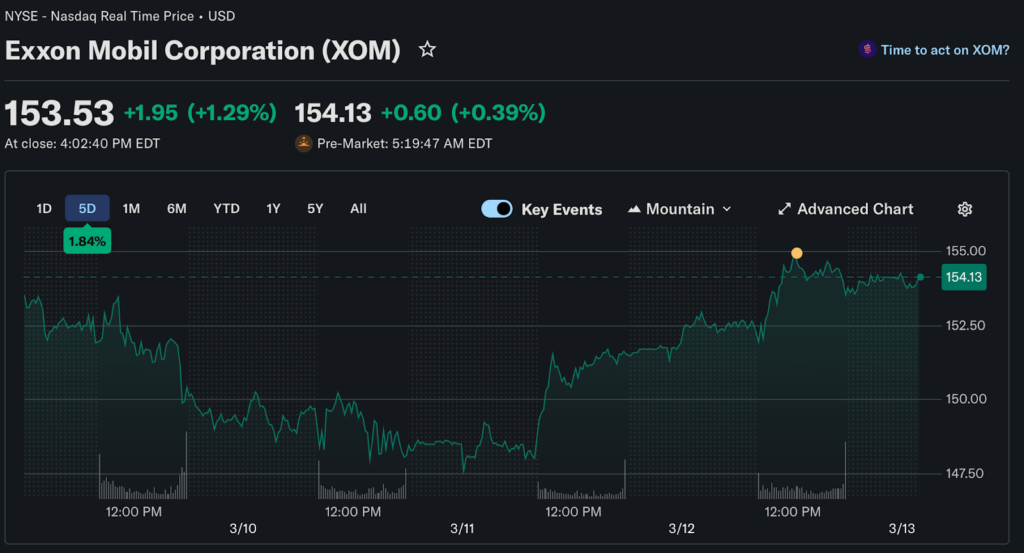
While most sectors closed Thursday deep in the red, integrated energy companies moved in the opposite direction. Both Exxon Mobil and Chevron finished the session higher, reflecting the direct revenue benefit that major oil producers receive when crude prices surge.
The complication for investors considering energy exposure is duration risk. Stocks in this sector are currently priced as if elevated crude persists for an extended period. A ceasefire announcement, a credible diplomatic framework, or even sustained rhetoric suggesting talks are progressing could pull oil back toward $70-$75 in a short window.
Positions built at $95 WTI would face significant paper losses in that scenario. Sizing energy exposure relative to one’s conviction on the conflict timeline, rather than the oil price alone, is the more disciplined framework right now.
The Dollar as a Hidden Amplifier
Dollar strength on Thursday added a layer to the oil shock that tends to get overlooked in headline coverage. The greenback appreciated against most major currencies as investors sought safety in US assets, which is a standard flight-to-quality response. But for economies that buy oil in dollars while generating income in local currencies, that dollar appreciation compounds the cost of every barrel imported.
European industrials, Japanese manufacturers, and Asian refiners face higher effective costs for two reasons simultaneously: the raw price of crude is up, and local currency purchasing power relative to the dollar is down. Energy-importing nations running current account deficits are most exposed, and their central banks will be managing currency pressures alongside inflation concerns in the weeks ahead.