
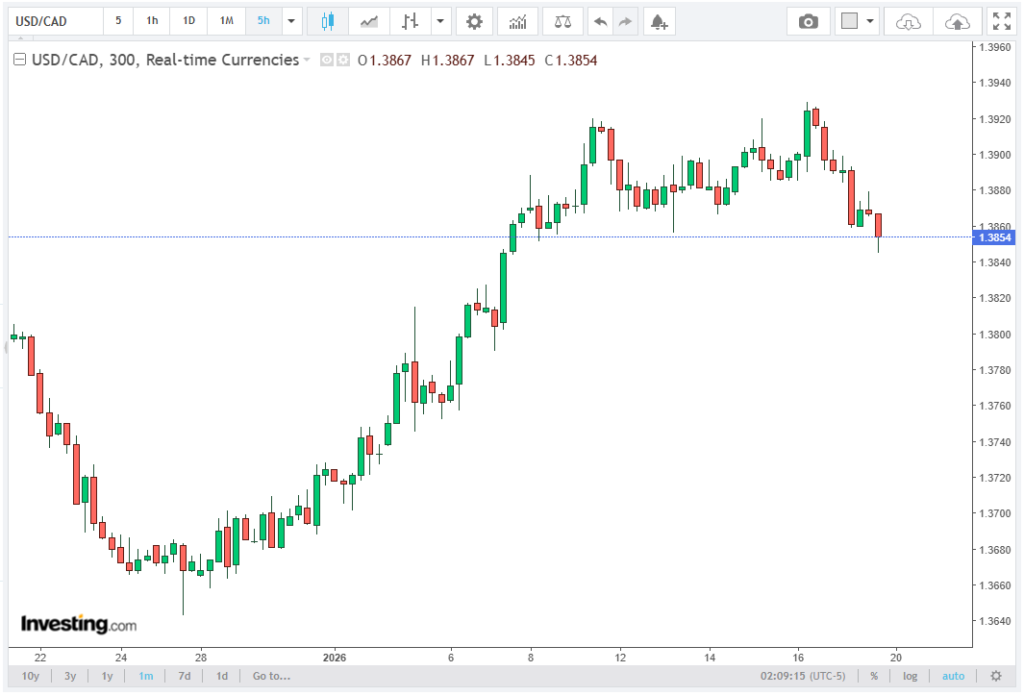
The USD/CAD currency pair has extended its recent slide, finding temporary support near the 20-day Exponential Moving Average (EMA) amid a softer US Dollar. As of early European trading on Tuesday, the pair trades around 1.3850, down approximately 0.13%, reflecting market concerns stemming from both geopolitical tensions and Canadian economic data. This article from FlexFlume delivers a clear and thorough explanation of the subject.
Key Drivers Behind USD/CAD Movement
Several factors are influencing the USD/CAD pair at present:
US Dollar Weakness: The US Dollar Index (DXY), tracking the Greenback against a basket of six major currencies, is slightly lower, slipping 0.12% and hovering around the 98.90 level. The recent softness in the USD is attributed to mounting geopolitical tension, particularly between the United States (US) and the European Union (EU) over Greenland.
Geopolitical Tensions: The US President recently imposed 10% tariffs on select EU countries and the United Kingdom (UK) in response to opposition over Greenland’s strategic acquisition plans. These tariff measures have been met with condemnation from the EU, which has threatened reciprocal countermeasures. The resulting uncertainty has increased market risk aversion, reducing the investment premium of the USD.
Canadian Inflation Data: Meanwhile, the Canadian Dollar (CAD) is benefiting from mixed Consumer Price Index (CPI) data released on Monday. The report showed that year-on-year (YoY) inflation in Canada accelerated in December, indicating persistent price pressures. However, month-on-month (MoM) data revealed a slight moderation, creating a nuanced backdrop for CAD strength.
Technical Analysis of USD/CAD
From a technical perspective, USD/CAD is exhibiting a near-term consolidation above key support levels.
20-Day EMA Support
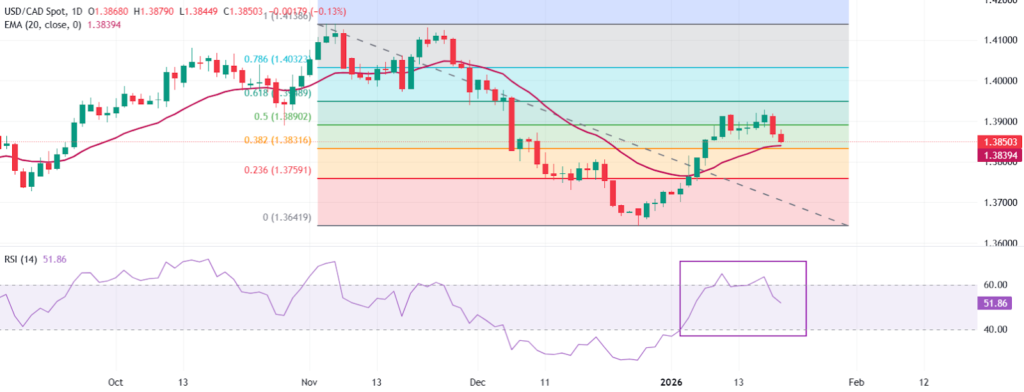
The pair is currently holding marginally above the 20-day EMA, which has risen to 1.3839. The positive slope of this EMA suggests a short-term bullish bias, despite the recent pullback. Traders often view the 20-day EMA as a critical dynamic support level, and a sustained hold above it can indicate that buyers remain interested in the pair.
Relative Strength Index (RSI)
The 14-day Relative Strength Index (RSI) sits at 52, recovering from recent oversold levels. This neutral reading implies that momentum is stabilizing and that the pair may be poised for either a continuation of the recovery or a consolidation phase. Traders should monitor the RSI for any movement toward overbought territory (above 70) or oversold conditions (below 30), which could signal impending trend reversals.
Fibonacci Retracement Levels
Measured from the 1.4139 high to the 1.3642 low, USD/CAD is currently correcting near the 38.2% Fibonacci retracement at 1.3832. Earlier attempts to stabilize above the 50% Fibonacci retracement at 1.3890 were unsuccessful, indicating that short-term resistance remains a hurdle.
Technical traders often rely on Fibonacci levels to identify potential reversal zones. In this case, a decisive break below 1.3832 could signal a further decline toward the 23.6% retracement at 1.3759, while a bounce above 1.3929, the high from January 16, could open the door for a move toward the psychological level of 1.4000.
Near-Term Outlook
The USD/CAD outlook remains cautiously bullish as long as the pair maintains support near the 20-day EMA. Key technical and psychological levels to watch include support at 1.3832 (38.2% Fibonacci retracement) and 1.3759 (23.6% retracement), while resistance is seen at 1.3929 (recent high) and the psychological barrier of 1.4000, which could test further bullish momentum.
Should the USD continue to face downward pressure amid geopolitical disputes, a test of EMA support could be imminent. Conversely, any US Dollar rebound, perhaps triggered by easing tensions or a shift in risk sentiment, could help the pair reclaim 1.3929 and potentially challenge the 1.4000 mark.
Conclusion
In summary, USD/CAD trades lower near 1.3850, reflecting US Dollar weakness and a rebound in the Canadian Dollar following stronger YoY inflation. The pair finds temporary support at the 20-day EMA, which currently offers a short-term bullish cushion. Momentum indicators, including the RSI, suggest stabilization, while Fibonacci retracement levels highlight potential support and resistance zones.
Traders should monitor key levels, particularly the 1.3832 Fibonacci support and the 1.3929 recent high, for signs of either a continuation of the corrective phase or the resumption of an upside trend. With geopolitical tensions and economic data releases likely to influence market sentiment, USD/CAD could experience continued volatility in the near term.
In essence, while the USD/CAD pair faces near-term pressure, the technical backdrop indicates that the 20-day EMA provides a temporary safety net, preserving the possibility of a recovery toward 1.4000 should the market stabilize.