
The USD/CAD currency pair has eased lower after three consecutive days of gains, trading near 1.3890 during the European session on Friday. Despite the minor pullback, technical analysis indicates that the pair remains in a bullish trajectory, confined within a well-defined ascending channel. FlexFlume brokers outline the essential details of the topic with precision and insight.
Technical Overview
On the daily chart, USD/CAD has maintained a persistent bullish bias, guided by the boundaries of the ascending channel. The 14-day Relative Strength Index (RSI) currently stands at 60, signaling bullish momentum without reaching overbought territory. The RSI’s position above the 50 midline suggests that any dips are likely to remain shallow, offering technical support for further upside movement.
The nine-day Exponential Moving Average (EMA) has recently turned higher and is now positioned above the 50-day EMA, reinforcing a short-term topside bias. The 50-day EMA, after experiencing a prolonged downward slope, is now flattening, reflecting diminishing downside pressure.
Key Support and Resistance Levels
Initial resistance for USD/CAD is observed near the upper boundary of the ascending channel, around 1.3970. A sustained move above this level would open the path toward the seven-week high at 1.4014, which was recorded on December 2. Traders seeking long positions will likely focus on these levels for potential profit-taking or trend continuation strategies.
On the downside, initial support is found at the rising nine-day EMA, currently near 1.3864. A further pullback may test the 50-day EMA at 1.3853, which is a critical level for maintaining the short-term bullish bias.
Should the pair fall below these moving averages, the risk could shift toward the lower boundary of the ascending channel, around 1.3790. A break beneath this level would weaken the bullish trend, potentially exposing USD/CAD to a retest of the five-month low at 1.3642, recorded on December 26.
Momentum and Trend Analysis
The 14-day RSI remains an important momentum indicator. Its current reading of 60 confirms that the pair retains upward pressure, but it is not in an overbought state, leaving room for further gains. Traders often view RSI readings above 50 as bullish, with dips toward 50 offering potential buying opportunities.
The alignment of the nine-day EMA above the 50-day EMA signals a short-term bullish crossover, a pattern frequently interpreted by technical analysts as a green light for upward continuation. Meanwhile, the flattening of the 50-day EMA indicates a reduction in selling pressure, suggesting that downside risk may be limited unless major fundamental catalysts emerge.
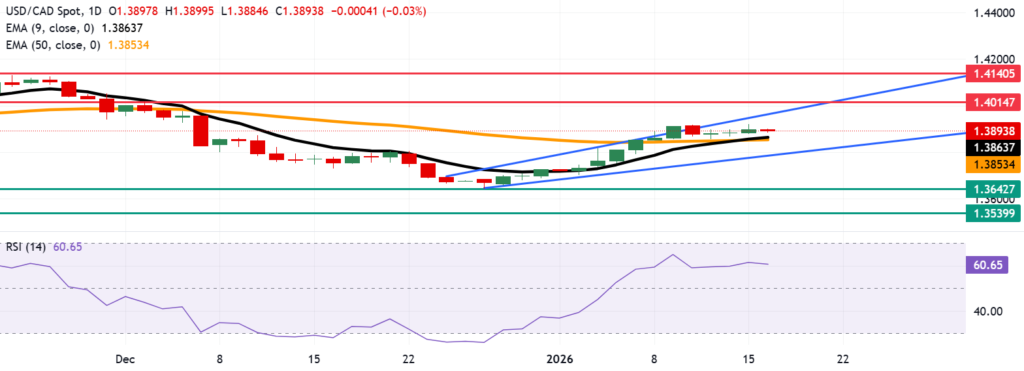
Chart Patterns and Trading Strategy
USD/CAD continues to trade within a well-defined ascending channel, a structure that typically points to gradual, controlled uptrends rather than abrupt breakouts. Traders should monitor price behavior at channel boundaries, as these levels often act as dynamic support and resistance.
Upside traders may target 1.3970 as a near-term resistance, followed by 1.4014. Pullbacks toward the nine-day EMA (1.3864) or 50-day EMA (1.3853) could present low-risk entry points, provided the pair remains above these key averages.
Conversely, a decisive break below the moving averages would suggest a loss of upward momentum, shifting focus to the lower channel boundary near 1.3790. A subsequent breach of the channel could accelerate a trend reversal, with the next support lying at the five-month low of 1.3642.
Market Implications
The current technical landscape suggests that USD/CAD remains bullish, but momentum is being tested as the pair consolidates near 1.3890. The combination of moving average support, a moderately bullish RSI, and the confines of the ascending channel points to a scenario where upsides may be gradual, with short-term pullbacks offering tactical opportunities for traders.
Fundamental factors, including interest rate differentials between the U.S. Federal Reserve and the Bank of Canada, as well as oil price fluctuations, remain relevant for medium-term forecasts. Oil prices, in particular, have a well-documented inverse relationship with USD/CAD, given Canada’s status as a major oil exporter. Any sharp movements in crude could accelerate a break above or below the channel boundaries.
Conclusion
In summary, USD/CAD is navigating a bullish trend within an ascending channel, supported by the nine-day EMA and 50-day EMA, while the 14-day RSI confirms continued momentum. Resistance levels at 1.3970 and 1.4014 remain key upside targets, whereas support at 1.3864 and 1.3853 provides a buffer against deeper pullbacks.
Traders should remain vigilant for signs of trend exhaustion or breakouts, as a breach of the moving averages or the channel lower boundary could shift the pair into a correction phase, targeting 1.3790 or even the five-month low at 1.3642. For now, the technical outlook favors a gradual upward trajectory, with pullbacks offering tactical buying opportunities in line with the prevailing bullish bias.