
Solana (SOL) has shown renewed bullish momentum after bouncing off the $80 floor, reigniting discussions about a potential trend reversal. Over the past 24 hours, SOL has jumped 4.3%, trading above the $80 level once again and signaling the possibility of a breakout above its key resistance near $90.
Strong trading volumes and record-setting network activity are contributing to heightened optimism among traders and analysts alike. The following article features a comprehensive overview of this topic from the brokers at BlitzPine Group.
Solana Transaction Volumes Hit Monthly Record
February marked a new high in Solana transaction volumes, with the blockchain processing 882 million transactions, just 8% shy of its all-time high from early February. Every month, these figures surpassed volumes from July 2025, when SOL was trading at $172 and approaching $200.
High transaction volumes typically indicate increased protocol activity and often occur during bull markets. Periods like this see speculators engaging with platforms such as Pump.fun or borrowing via decentralized finance solutions like Kamino, which can drive network congestion and activity metrics.
Interestingly, despite this surge in on-chain activity, SOL’s price has not mirrored the same bullish trajectory. Analysts attribute this divergence to en masse liquidations on protocols like Pump.fun and other meme coin launchpads, which may have caused a spike in asset transfers without immediate upward price movement.
SOL Retreats Off $90 But Bullish Momentum Persists
Despite SOL retreating off the $90 resistance, bullish signals remain intact. The 4-hour price chart indicates that SOL has been trading within a tight range between $76 and $90 for over a month. On Wednesday, SOL reached the $90 level but fell by over 10% within days due to selling pressure.
Analysts point to decisional candles on shorter timeframes, particularly the 1-hour chart, to identify potential swing and scalping opportunities. These candles, characterized by above-average trading volumes, are key indicators of strong directional moves when they occur near significant support or resistance levels.
Currently, SOL is expected to retest the $90 area within the next 24 to 48 hours. Any pullbacks below $87 that push the token toward $80 are seen as potential late entry points. Traders are eyeing the $83 level as an attractive entry zone, offering a 3x risk-reward ratio with a take-profit target at $92. A successful break above $90 could pave the way toward $100 in the near term.
$80 Floor Confirms Strong Buying Interest
The recent volume spike indicates that SOL buyers were waiting at the $80 support, confirming a robust floor level. The Relative Strength Index (RSI) has climbed above the 14-period moving average, sending a buy signal and suggesting that bullish momentum is gaining traction.
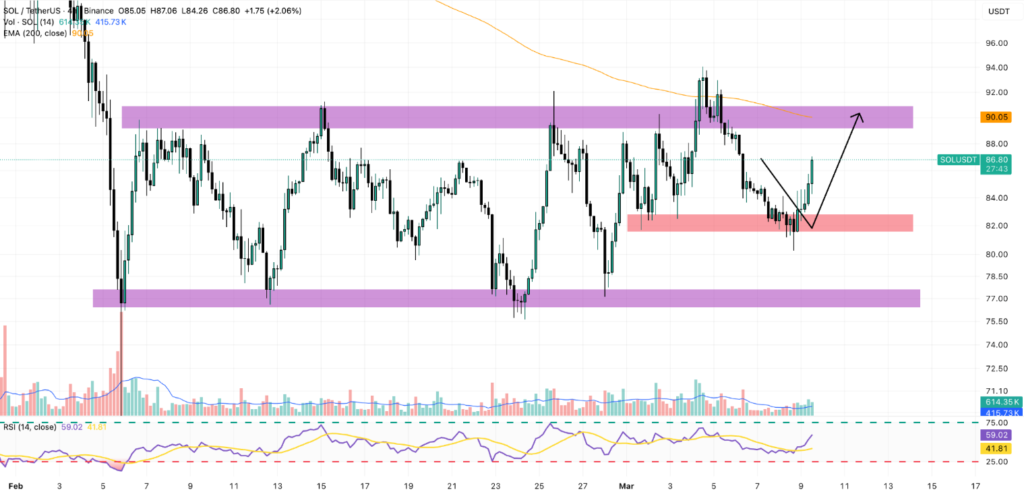
If RSI surpasses the 60 level, it would strengthen the case for a strong retest of $90, signaling a potential trend reversal. The presence of high-volume buy orders at $80 reflects traders’ confidence that this level could serve as a reliable foundation for a renewed uptrend.
Solana Network Activity Signals Growing Market Confidence
Recent spikes in Solana’s network activity are sending strong signals about market confidence in SOL. February’s monthly transaction record demonstrates that protocol usage is not only robust but also expanding despite short-term price consolidations. High activity across platforms like Pump.fun and Kamino indicates that users are increasingly engaging with DeFi applications, which historically correlates with future price appreciation.
This sustained on-chain activity, combined with strong trading volumes above $4 billion, suggests that SOL’s $80 floor is supported by real network demand, reinforcing the potential for a bullish breakout above the $90 resistance in the coming sessions.
Buy Signal Emerges During American Session
On the hourly chart, a buy signal emerged during the American trading session, a pattern typically associated with high-conviction buying. This suggests that short-term traders are actively positioning themselves for a potential breakout above $90, which could trigger aggressive upward momentum.
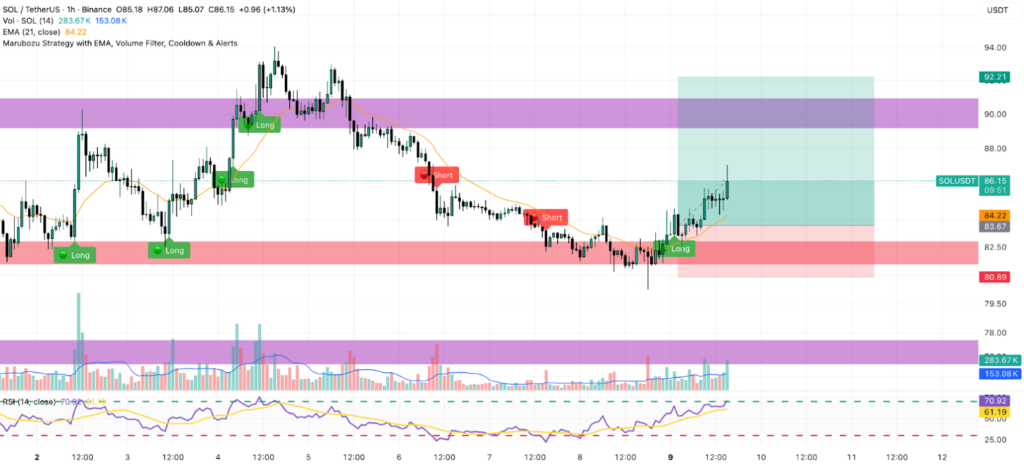
Coupled with record transaction volumes, sustained network usage, and technical indicators, this buy signal highlights the growing likelihood of a bullish trend emerging in SOL.
Looking Ahead: Breakout Potential
SOL’s current consolidation above $80, coupled with its recent price spike and network activity record, creates a favorable setup for a potential breakout. A confirmed move above $90 could accelerate a bull run, with technical targets near $100 in the short term.
Investors and traders should monitor transaction volumes, RSI levels, and hourly chart signals for confirmation of a trend reversal. If SOL maintains support above $80 and retests $90 successfully, the odds of a breakout are significantly enhanced.
In summary, Solana’s combination of record network activity, strong support at $80, and bullish technical signals makes it one of the most closely watched altcoins this week. With momentum building, SOL could soon resume its upward trajectory, attracting traders and investors seeking opportunities in the DeFi and crypto ecosystem.