
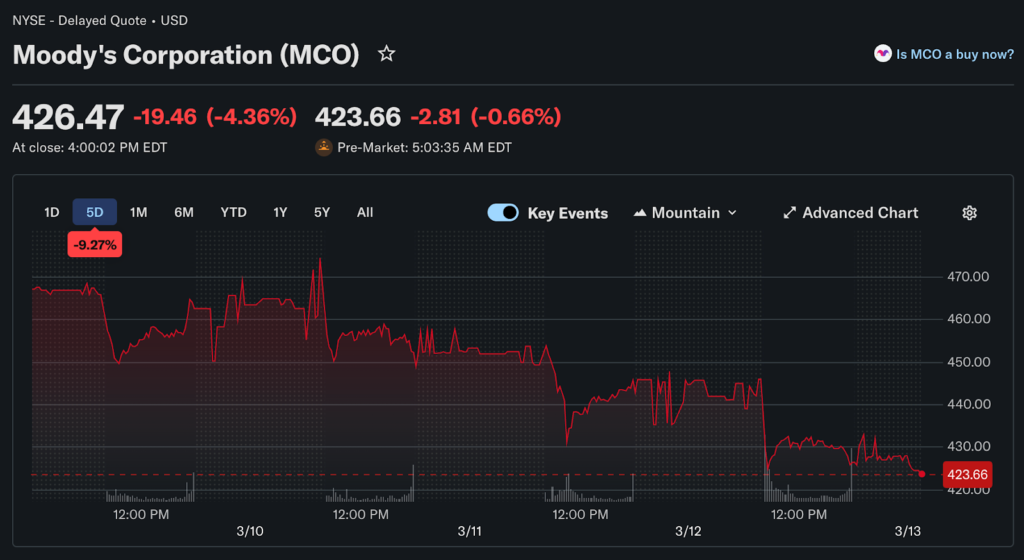
Wednesday’s Bureau of Labor Statistics release showed consumer prices rising 0.3% in February against the prior month, with the annual rate holding at 2.4%. Core inflation, stripping out food and energy, printed at 2.5% year over year. Both figures landed exactly where Wall Street expected them.
Finance expert at TibiPro points out that the February CPI will go down as one of the more misleading data points of 2026, not because the numbers are wrong, but because the world changed significantly after the survey period closed.
Clean Data, Wrong Moment
February’s CPI data is accurate by every technical standard. It just describes an economy that no longer exists in quite the same form. The reference period ended before US and Israeli military strikes on Iranian infrastructure began on February 28, which means the entire oil price shock that followed is absent from the report entirely.
Shelter costs rose just 0.1% in February, the smallest monthly increase recorded since early 2021, which is genuinely good news for the component that has been the most persistent inflation driver over the past five years. Food prices moved up 0.4% on the month and sat 3.1% higher year over year.
Egg prices dropped 3.8%, extending an annual decline of 42.1%. Medical care services climbed 0.6% for the month and are running 4.1% above February 2025 levels. That profile fits an inflation environment gradually normalizing toward the Federal Reserve’s 2% objective.
A Shutdown-Shaped Hole in the Data
Before getting to the oil shock problem, there is a separate statistical issue embedded in recent CPI readings that has received less attention than it deserves. Last fall’s 43-day government shutdown cut off the Bureau of Labor Statistics from collecting price data during October. Rather than leaving a gap, the BLS applied a carry-forward approach that assumed prices in the affected categories were unchanged for that month.
Economists estimate that substitution created a downward bias of roughly 0.3 percentage points in the annual CPI. Moody’s put the adjusted figure closer to 2.7%, meaningfully further from the Fed’s 2% target than the headline implies. The distinction matters for understanding how much progress the central bank had actually made before the oil disruption arrived.
What Oil Prices Do to Forward Inflation
Energy’s absence from February’s numbers is not a quirk of measurement. It is a structural feature of how CPI surveys work. Prices collected in early-to-mid February simply cannot reflect conditions that materialized in late February and March. The national average for unleaded gasoline has moved from roughly $2.93 per gallon to $3.54 between February and the first weeks of March, a 21% increase that will show up clearly in the March CPI when it is released in April.
The downstream effects extend further than the pump. Jet fuel tracks crude oil closely, and airline fares running at 2.2% annual inflation in January could accelerate sharply as carriers reprice routes to reflect higher fuel costs. Fertilizer, manufactured using natural gas that tracks crude directionally, adds agricultural exposure to the same supply chain pressure.
If oil holds near $100 per barrel through the rest of 2026, analysts at J.P. Morgan and Moody’s estimate the annual CPI rate could reach 3.5% by December, a full percentage point above the February reading and well above what monetary policy had been calibrated to manage.
The Fed Walks a Difficult Line
Long-dated Treasury yields moved higher on Thursday regardless of what Wednesday’s CPI showed. The 10-year yield reached 4.26%, reflecting inflation expectations being repriced in real time by a bond market that is not waiting for future CPI prints to draw its conclusions. The 30-year yield added to that move, and the 2-year note climbed sharply as well.
That bond market repricing creates a specific problem for the Federal Reserve. A central bank managing a demand-driven inflation overshoot can raise rates, cool borrowing, reduce spending, and bring prices down. A central bank facing a supply-side energy shock deals with a different equation entirely. Higher rates do not produce more oil or reopen shipping lanes. They slowed credit growth and business investment in an economy that was already decelerating before the disruption began.
What Actually Matters From Here
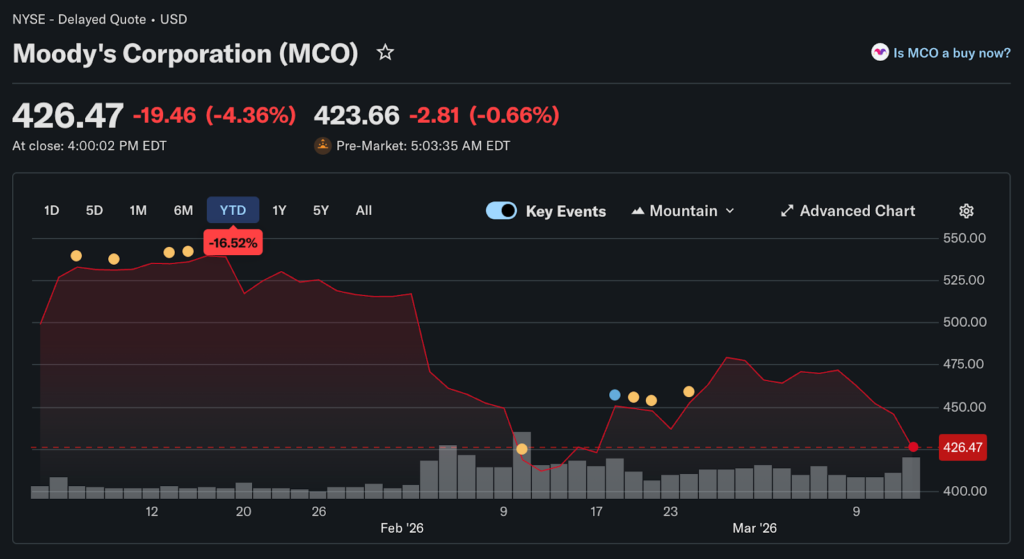
The February CPI showed where prices stood before the disruption. That baseline will be useful for measuring how much the oil shock eventually adds, but using it to guide current market positioning or Fed expectations is a mistake.
March and April CPI releases will carry the real signal for 2026 inflation. January’s PCE index, the Fed’s primary inflation benchmark and running at approximately 2.9% annually, is due Friday, but it also predates the oil shock. Investors tracking Fed rate expectations should discount both near-term data releases accordingly and focus instead on the diplomatic and military developments in the Middle East, which will determine whether the inflation trajectory bends back down or continues climbing through the second quarter.