
Bitcoin (BTC) has recently rebounded from a strong long-term support zone near $60,000, signaling renewed confidence among investors. This rebound has allowed Bitcoin to outperform gold (XAUUSD) in early March, as market participants shifted toward risk assets amid easing geopolitical tensions. The experts at BlitzPine Group provide a detailed explanation of this topic in this article.
The recent volatility in global financial markets was primarily driven by geopolitical developments surrounding the Iran conflict, which initially prompted traders to seek safe-haven assets. Following the initial spike in market uncertainty, Bitcoin tested its key support levels, while gold maintained its bullish momentum, reflecting its traditional role as a store of value.
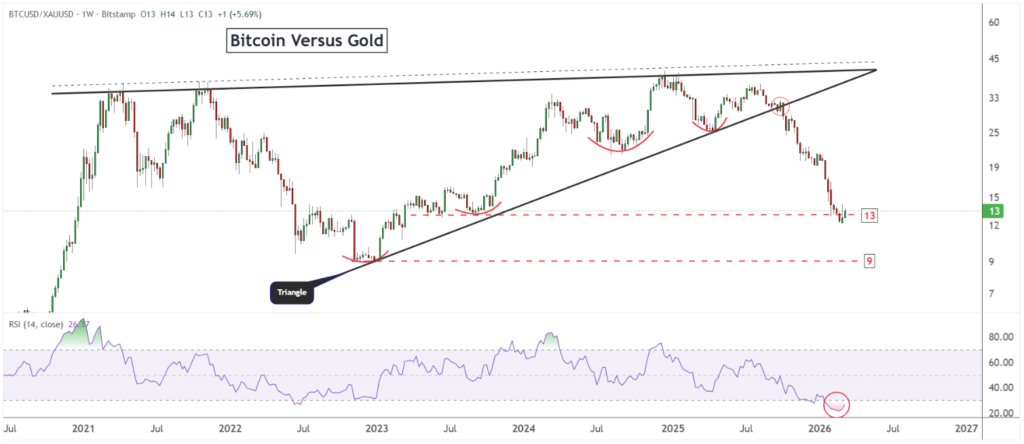
The Bitcoin-to-gold ratio, an essential metric for comparing digital assets with traditional safe-haven metals, is currently stabilizing near a major support level. This level will be crucial in determining whether Bitcoin experiences further downside or enters a strong recovery phase.
The Bitcoin-to-Gold Ratio: A Critical Indicator
The Bitcoin-to-gold ratio measures the relative strength of Bitcoin versus gold. An increase in the ratio suggests Bitcoin is outperforming gold, while a decline indicates gold is leading. Recent charts indicate that the ratio broke a triangle pattern in September 2025, triggering a strong drop toward long-term support of 13. This breakout initiated a correction in Bitcoin prices toward the $60,000 support level.
Currently, the ratio is consolidating above 13, providing support to Bitcoin prices. Should this support hold, Bitcoin could rally toward $100,000. Conversely, a break below 13 may result in a sharp decline toward $35,000, reflecting the sensitivity of Bitcoin to both market sentiment and liquidity conditions.
The divergence between Bitcoin and gold illustrates their differing market behaviors. While gold reacts primarily to long-term macroeconomic risks such as inflation, currency debasement, and sovereign debt concerns, Bitcoin is highly responsive to changes in risk appetite and short-term liquidity conditions. This makes Bitcoin a dynamic asset in volatile markets, often leading to rapid shifts in the Bitcoin-to-gold ratio.
Technical Structure: Bitcoin’s Key Support Zone
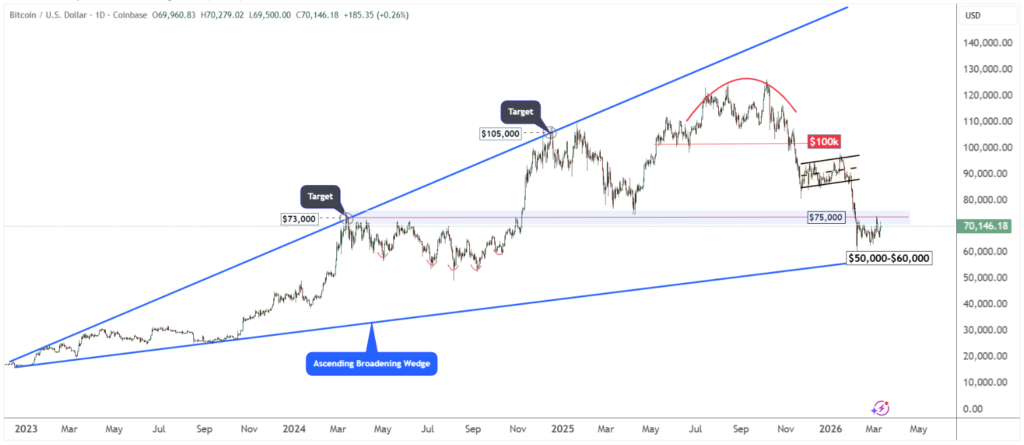
Bitcoin’s technical charts show the formation of an ascending broadening wedge, with key support between $50,000 and $60,000. As long as Bitcoin consolidates above $50,000, the probability of a bottom formation and subsequent rally toward $100,000 increases.
However, if Bitcoin breaks below $50,000, it would constitute a major technical breakdown, opening the door for a decline toward $35,000. It is important to note that Bitcoin has already experienced a 40% drop from its peak of $126,000, meaning the market is still recovering from a significant correction. Investor confidence is gradually returning, suggesting that any rally is likely to be measured rather than immediate.
Additionally, Bitcoin’s rebound from $60,000 aligns with the support levels identified on both daily and weekly charts, reinforcing the potential for a bottom if price momentum continues to hold. Traders monitoring the ascending wedge pattern should also watch for volume spikes, which may confirm either a sustained recovery or a potential breakdown.
Gold’s Continued Bullish Momentum
Gold (XAUUSD) continues to display resilient bullish momentum, despite Bitcoin’s recent outperformance. As a traditional safe haven, gold is less sensitive to short-term market sentiment and responds mainly to macro-level risks, such as inflationary pressures, monetary policy shifts, and sovereign debt concerns.
While Bitcoin benefits from rapid market reactions, gold offers stability, which is particularly attractive during periods of geopolitical uncertainty. In March, gold prices experienced a modest 2% decline, compared to Bitcoin’s 5% gain, reflecting a temporary shift in investor preference toward riskier digital assets as geopolitical fears began to ease.
Market Implications of Bitcoin and Gold Trends
The recent divergence between Bitcoin and gold carries important market implications for investors and traders. As Bitcoin rebounds from its key support zone, it signals growing risk-on sentiment and increased appetite for digital assets. Meanwhile, gold’s steady bullish momentum reflects continued demand for traditional safe havens amid lingering macroeconomic uncertainties.
Conclusion: Outlook for Bitcoin and Gold
The relationship between Bitcoin and gold remains a key barometer of investor sentiment. Bitcoin’s recent rebound from $60,000 highlights its role as a digital alternative to traditional safe-haven assets, particularly during periods of improving risk appetite.
Looking ahead, macroeconomic conditions and geopolitical developments will determine which asset dominates. In scenarios of heightened market volatility, gold may once again emerge as the preferred safe haven, while Bitcoin may experience temporary weakness. Conversely, if risk appetite improves and liquidity returns to financial markets, Bitcoin could continue its outperformance, potentially driving the Bitcoin-to-gold ratio higher in the coming months.
Investors are advised to monitor both the technical support zones in Bitcoin and the macro trends impacting gold. This dual approach provides a comprehensive view of market dynamics and ensures informed decision-making amid ongoing economic and geopolitical uncertainty.