
Gold (XAU/USD) rebounded above the $4,600 level on Friday, recovering losses seen earlier in the week, despite a fading safe-haven demand. Investors closely monitored geopolitical developments and US economic data, which influenced market sentiment and expectations for Federal Reserve policy. The FlexFlume team presents a structured and informative breakdown of this matter.
Gold Gains Amid Easing Geopolitical Tensions
Gold surged to $4,610, regaining daily losses after a temporary dip caused by easing geopolitical risks in Iran. The US President signaled that military action might be delayed following Iran’s pledge not to execute protesters. This announcement was reinforced by reports that Israel and other regional allies urged the United States to refrain from any immediate strike.
The calming of geopolitical tensions reduced the traditional safe-haven demand for Gold, which typically rises during periods of heightened uncertainty. As a result, Gold’s recent gains were tempered by improving risk sentiment, even as traders remained cautious about potential future developments in the Middle East.
Economic Data Supports Fed Rate Hold
Gold, as a non-interest-bearing asset, is sensitive to expectations about interest rates. Thursday’s US Initial Jobless Claims unexpectedly fell to 198,000, below market expectations of 215,000, signaling a strong labor market. This reinforced the view that the Federal Reserve is likely to maintain interest rates on hold in the near term.
The US Department of Labor (DOL) data confirms that layoffs remain limited despite prolonged high borrowing costs, providing further support for the Fed’s cautious stance. Fed funds futures now price the next rate cut for June 2026, reflecting continued confidence in economic resilience and the persistence of sticky inflation.
Additional economic indicators, such as the US Census Bureau’s Retail Sales report, revealed a stronger-than-expected increase of 0.6% in November, following a contraction in October. Meanwhile, the Producer Price Index (PPI) showed both headline and core measures at 3% year-over-year (YoY), underscoring ongoing inflationary pressures.
US Dollar and Gold Dynamics
The US Dollar Index (DXY), which measures the dollar against six major currencies, traded around 99.30 on Friday, after modest gains earlier in the week. The relatively stable DXY limited Gold’s upside momentum, as a stronger US Dollar generally makes dollar-denominated Gold more expensive for foreign buyers.
Gold also reacted to market assurances regarding Fed Chair Jerome Powell, as the US President indicated he had no plans to dismiss him despite prior political pressures. This helped support risk assets and slightly reduced Gold’s appeal as a hedge against uncertainty.
Market Expectations and Fed Commentary
Financial institutions, including Morgan Stanley, pushed their expectations for the next rate cuts to June and September from earlier projections in January and April, following the positive jobs report. Minneapolis Fed President Neel Kashkari echoed similar sentiments, noting the US economy remains resilient and that tariff pass-through effects have been lower than expected.
The Fed Beige Book pointed to a gradual improvement in economic activity, noting that growth has strengthened at a slight to modest pace across most regions since mid-November. This signals a clear uptick in momentum compared with earlier assessments, which had painted a more subdued picture.
Meanwhile, US Core CPI, excluding food and energy, rose 0.2% in December, with annual core inflation at 2.6%, matching a four-year low and suggesting inflationary pressures are gradually easing.
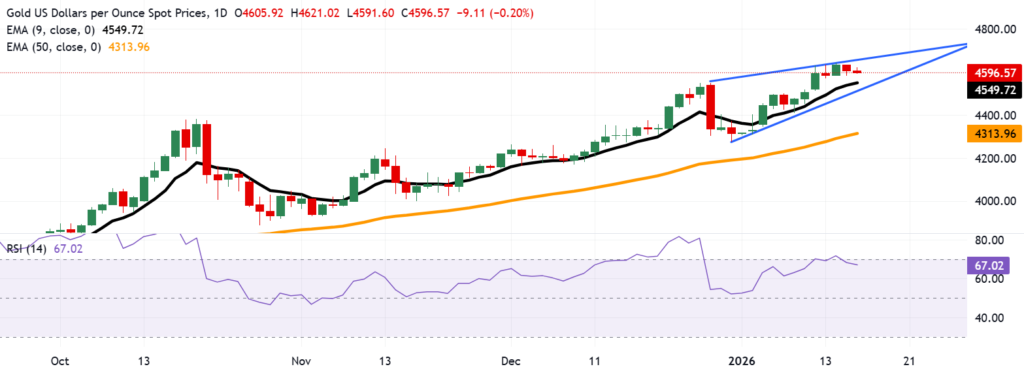
Technical Outlook: Ascending Wedge Signals Fading Momentum
From a technical analysis perspective, Gold is currently trading within an ascending wedge, a pattern that often signals fading upside momentum. A bearish reversal could occur if Gold breaks below the wedge’s lower trendline with strong volume.
Immediate resistance lies at the record high of $4,643, followed by the upper boundary of the wedge around $4,660. A sustained break above this confluence resistance zone could push Gold toward $4,700.
On the downside, support is visible at the nine-day Exponential Moving Average (EMA) at $4,549, followed by the wedge’s lower boundary near $4,520. A breach of these levels would open the door for Gold to test the 50-day EMA at $4,313, highlighting potential downside risks for short-term traders.
Conclusion
Gold’s recovery above $4,600 underscores the interplay between geopolitical developments, US economic data, and monetary policy expectations. While easing tensions in Iran and strong labor market figures have tempered its safe-haven appeal, the precious metal remains sensitive to inflation trends, Fed guidance, and technical levels in the XAU/USD market.
Traders should monitor resistance at $4,643–$4,660 and support near $4,520–$4,549, as breaking these levels could set the next significant trend for Gold. With market sentiment fluctuating in response to both domestic and international developments, Gold continues to provide a nuanced gauge of risk appetite and monetary policy expectations.