
The BTC/USD pair is flashing strong bullish signals as Bitcoin price action accelerates on a mix of regulatory clarity, cooling inflation, and renewed institutional demand. After weeks of consolidation, the world’s largest cryptocurrency appears to be approaching a decisive breakout, with both fundamental catalysts and technical structures aligning in favor of the bulls.
PrimeLuno experts deliver a detailed and insightful analysis of the subject in their latest piece.
Key Market Developments Driving Bitcoin Higher
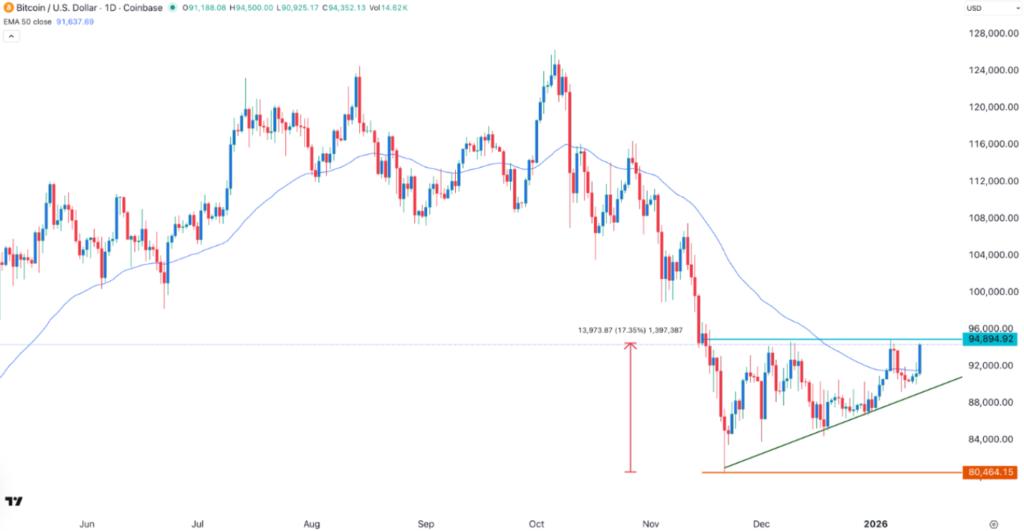
Bitcoin rebounded sharply, climbing to a high of $94,400, its highest level since January 5. This rally marks a gain of over 17% from its November low, when the price briefly dipped to $80,465. The rebound was driven by a combination of US regulatory progress, macroeconomic tailwinds, and ETF inflows, all of which have improved risk sentiment across crypto markets.
Two developments stand out: the publication of the CLARITY Act text by a US Senate committee and a decline in core US inflation, both of which are viewed as structurally bullish for Bitcoin and the broader digital asset ecosystem.
CLARITY Act and Regulatory Optimism
The BTC/USD pair surged after the Senate Banking Committee released the full text of the CLARITY Act, a long-anticipated piece of legislation aimed at resolving regulatory uncertainty in the crypto industry.
This bill, which now advances to the markup stage on Thursday, proposes a clear separation of responsibilities between the Securities and Exchange Commission (SEC) and the Commodity Futures Trading Commission (CFTC). Under the framework, the CFTC would assume broader oversight of crypto commodities, a move widely viewed as industry-friendly.
Markets reacted positively because regulatory clarity reduces compliance risk, encourages capital formation, and makes it easier for institutional investors to deploy funds into Bitcoin and related products. Historically, periods of clearer regulation have coincided with higher liquidity, lower volatility, and stronger long-term price trends.
ETF Inflows Signal Institutional Demand
Another key tailwind for Bitcoin price has been the return of inflows into spot Bitcoin ETFs. After suffering outflows last week, these products have added millions of dollars in assets over the past few sessions, signaling a renewed appetite from institutional players.
ETF inflows matter because they represent real spot demand, not leveraged speculation. Rising ETF allocations suggest that asset managers, hedge funds, and long-term investors are repositioning for higher prices, possibly in anticipation of both regulatory progress and easier monetary conditions.
This shift in flows has helped stabilize the market and reinforce the view that Bitcoin is transitioning from a corrective phase back into a trend-driven advance.
Cooling Inflation and Federal Reserve Expectations
Bitcoin also benefited from macroeconomic data released by the Bureau of Labor Statistics, which showed that the core Consumer Price Index (CPI) declined in December. This moderation in inflation strengthens the argument that price pressures are easing, especially as energy prices and mortgage rates continue to trend lower.
Lower inflation is typically bullish for Bitcoin, as it increases the likelihood that the Federal Reserve will adopt a more dovish policy stance. An easier monetary policy tends to weaken the US dollar and boost non-yielding assets such as Bitcoin.
Supreme Court Tariff Ruling as a Wildcard Catalyst
Another potential catalyst lies outside traditional crypto narratives. Markets are watching the Supreme Court’s upcoming ruling on the U.S. tariffs. A decision to end these tariffs, and possibly mandate refunds, would be seen as disinflationary, reducing import costs and easing pressure on consumer prices.
Such an outcome would likely reinforce expectations of lower inflation, indirectly benefiting Bitcoin by strengthening the case for looser financial conditions and improved risk appetite across global markets.
BTC/USD Technical Analysis: Ascending Triangle in Focus
From a technical analysis perspective, the daily chart paints an increasingly bullish picture. The BTC/USD pair has rallied from 80,465 in November to around 94,330, forming a sequence of higher lows.
Importantly, Bitcoin has moved above the 50-day Exponential Moving Average (EMA), a classic signal of trend reversal and bullish continuation. This move confirms that short- to medium-term momentum has shifted decisively in favor of buyers.
Even more compelling is the formation of an ascending triangle pattern, characterized by a horizontal resistance zone near recent highs and a rising trendline connecting higher lows. This pattern typically signals accumulation and often resolves with a strong upside breakout.
Outlook: Path Toward $100,000
Given the confluence of bullish fundamentals and technical strength, the ascending triangle points to a potential continuation rally toward the psychological resistance at $100,000. A confirmed breakout above the current resistance zone, supported by volume expansion, would validate this target.
In summary, BTC/USD is sitting at the cusp of a strong bullish breakout, driven by regulatory clarity, ETF inflows, cooling inflation, and constructive chart patterns. While volatility remains inherent to crypto markets, the balance of evidence currently favors further upside in the near term.