
The BTC/USD pair has entered a period of consolidation after a strong start to the month, with prices retreating amid rising geopolitical risks, shifting macroeconomic expectations, and renewed risk-off sentiment across global markets. PrimeLuno experts offer a detailed and insightful analysis of the subject.
Despite the recent pullback, the broader technical structure continues to suggest a bullish outlook, especially as Bitcoin remains above a critical 50-day Exponential Moving Average (EMA).
Bitcoin Price Rally Eases Amid Global Uncertainty
The recent Bitcoin price retreat mirrors the broader decline seen across global equities, cryptocurrencies, and other risk-sensitive assets. The sell-off accelerated as geopolitical tensions resurfaced following comments from the US President regarding the Greenland issue.
He warned that the United States could impose tariffs on several NATO members if it fails to achieve its objective of acquiring Greenland, a semi-autonomous territory under Danish control. He reiterated that the acquisition is vital for US national security, a statement that unsettled financial markets already sensitive to geopolitical disruptions.
As a result, investors rapidly shifted toward a risk-off posture, triggering a sharp decline in global stock indices on Monday. Historically, periods of geopolitical uncertainty tend to reduce appetite for speculative assets, and Bitcoin was no exception.
Bitcoin Fails to Act as a Safe Haven
One of the most notable developments during this pullback is that Bitcoin did not behave as a safe-haven asset, challenging a long-held belief among some analysts. Instead of flowing into BTC, investors rotated capital into gold, which surged to a new record high during the same session.
This divergence reinforces the view that Bitcoin, while often described as “digital gold,” still trades largely as a risk asset, particularly during periods of macro-driven volatility. The contrast between falling BTC prices and surging gold prices underscores Bitcoin’s ongoing correlation with risk sentiment, rather than with traditional defensive assets.
ETF Outflows Add Downside Pressure
Another key factor behind the BTC/USD weakness has been the surge in spot Bitcoin ETF outflows. According to recent data, US-listed spot BTC ETFs shed more than $350 million on Friday, extending a trend that has continued into this week.
These outflows suggest waning institutional demand, at least in the short term. ETFs have been a major driver of Bitcoin’s rally over recent months, and persistent redemptions tend to amplify downward price pressure, especially during periods of elevated uncertainty.
Regulatory Concerns Weigh on Sentiment
Adding to the pressure are renewed regulatory concerns surrounding the CLARITY Act, which stalled last week in the US Senate Banking Committee. The setback followed Coinbase’s withdrawal of support, citing concerns over provisions related to stablecoin rewards.
Coinbase has argued that restrictions on stablecoin rewards could undermine innovation, while banks and credit unions have lobbied aggressively against such incentives, warning they could trigger capital flight from the traditional banking system. This regulatory impasse has injected fresh uncertainty into the broader crypto policy landscape, dampening investor confidence.
Macro Data in Focus: PCE and the Federal Reserve
Looking ahead, the BTC/USD pair is likely to remain sensitive to upcoming US macroeconomic data, particularly the Personal Consumption Expenditure (PCE) inflation report. The PCE is the Federal Reserve’s preferred inflation gauge, and the results could significantly influence expectations around interest rate cuts later this year.
A cooler-than-expected PCE reading may revive demand for risk assets, including Bitcoin, by reinforcing the case for monetary easing. Conversely, persistently high inflation could strengthen the US dollar and weigh further on BTC/USD.
BTC/USD Technical Analysis: Bulls Still in Control
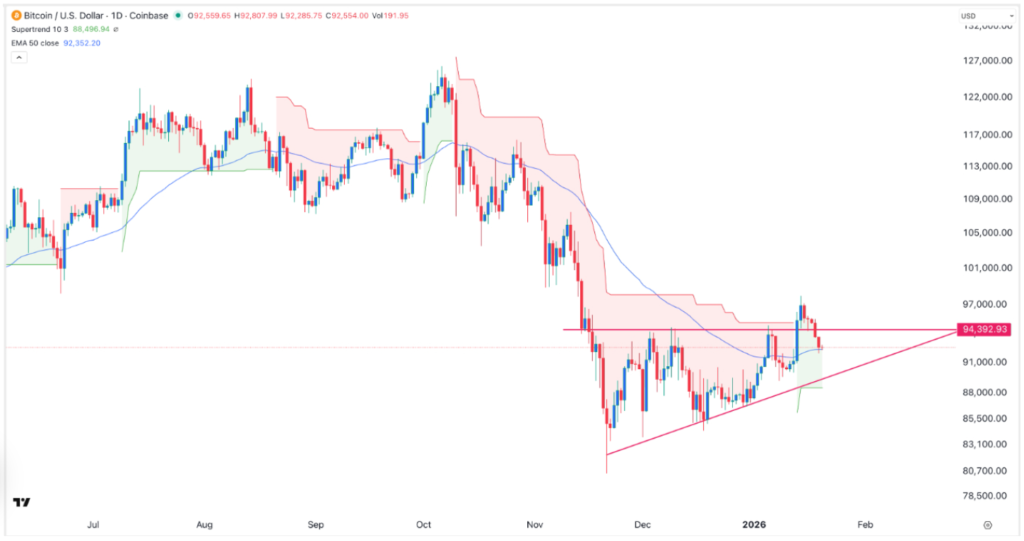
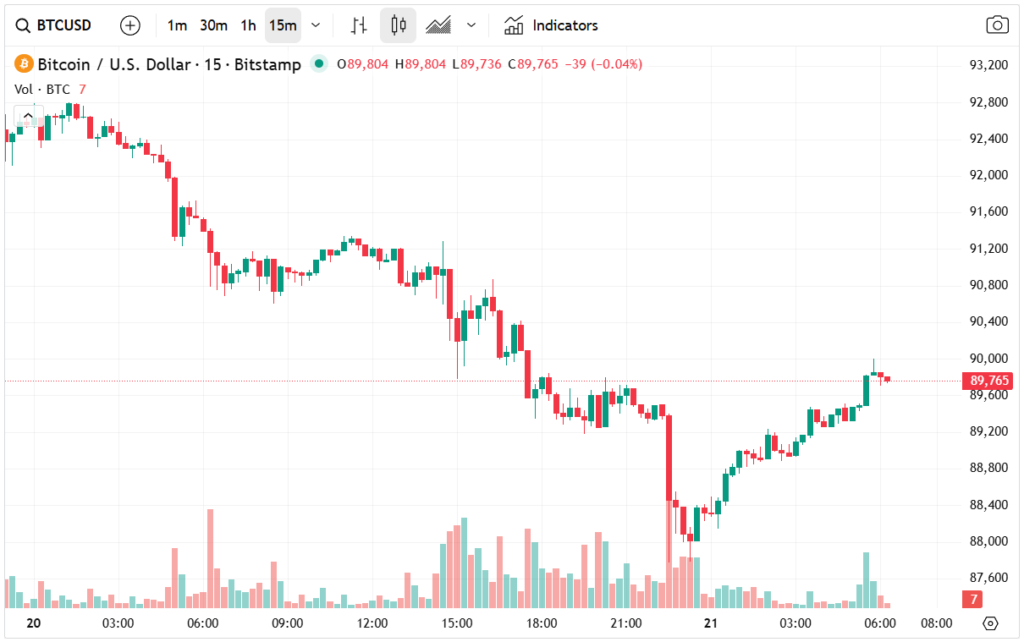
From a technical perspective, the outlook remains cautiously bullish despite the recent correction. On the daily chart, the BTC/USD pair has retreated from its recent high of 97,730 to around 92,560, marking its lowest level in over a week.
Importantly, Bitcoin has slipped below the key support level at 94,392, which represents the upper boundary of an ascending triangle pattern. This breakdown explains the recent acceleration in selling pressure.
However, a critical bullish signal remains intact: BTC is still trading above the 50-day Exponential Moving Average (EMA). This moving average has acted as a dynamic support zone throughout the broader uptrend and suggests that the current move may be a pullback rather than a trend reversal.
BTC/USD Forecast: Bullish Bias Above 50-Day EMA
As long as Bitcoin holds above the 50-day EMA, the path of least resistance remains to the upside. Bulls are likely to regroup and attempt another push toward the key resistance level at 94,400. A decisive break above this zone could open the door for a retest of the 97,700–98,000 region.
In summary, while short-term risks remain elevated due to geopolitics, ETF outflows, and regulatory uncertainty, the medium-term BTC/USD outlook stays constructive, supported by technical structure and broader market trends.