
The BTC/USD pair continues to command global attention as Bitcoin (BTC) consolidates just below its recent highs. After a powerful rally earlier this year, the world’s largest cryptocurrency has entered a tight consolidation range, a behavior that often precedes a major breakout. The brokers at FlexFlume provide a comprehensive breakdown of this topic in this article.
Despite short-term pressure from regulatory uncertainty and ETF outflows, the broader technical and macro outlook suggests that the bullish trend remains intact, with a potential move toward the psychological $100,000 level.
Bitcoin Price Action Remains Resilient
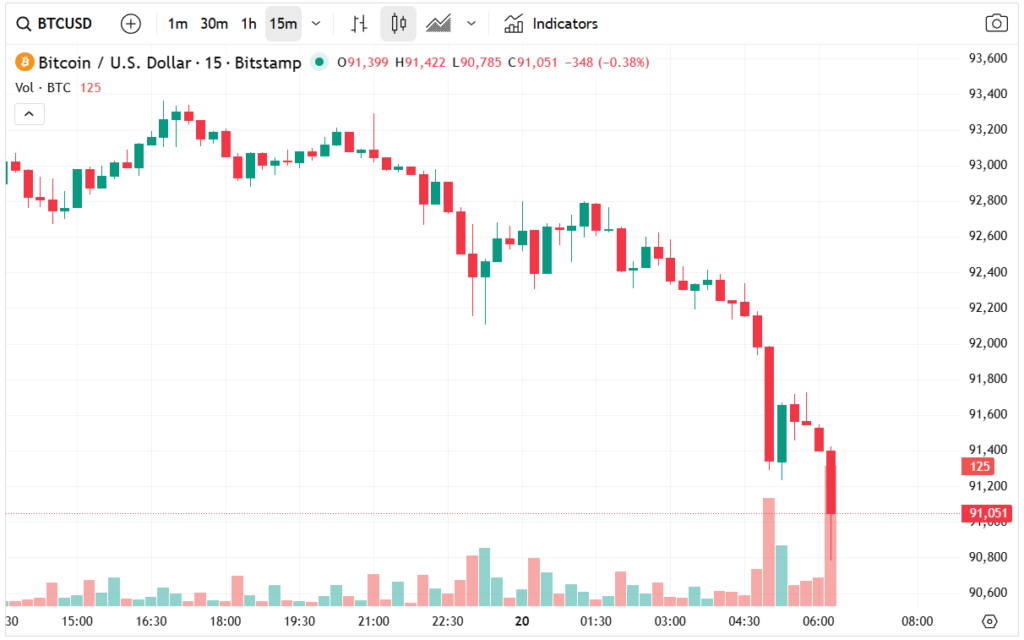
The Bitcoin price remained in a narrow trading range on Monday, extending a sideways performance that began late last week. At the time of analysis, the BTC/USD pair was trading near $95,000, slightly lower than the year-to-date high of $98,000.
This type of price compression is often interpreted by technical traders as a continuation pattern, particularly when it occurs after a strong upward move. Importantly, Bitcoin has not invalidated its bullish structure, as buyers continue to defend key support levels aggressively.
Market participants appear to be in a wait-and-see mode, reacting cautiously to developments in Washington, while keeping a close eye on macro catalysts that could reignite momentum.
Bitcoin ETF Outflows and the CLARITY Act Impact
One of the main reasons behind the recent pullback in the BTC/USD pair was growing uncertainty surrounding the CLARITY Act, a highly anticipated crypto regulatory bill in the United States. The Senate Banking Committee paused the markup process last week after Coinbase withdrew its support, sending a wave of pessimism through the crypto market.
Why Coinbase Withdrew Support
Coinbase cited multiple concerns, but the most critical issue was the proposed ending of stablecoin returns by American crypto exchanges. Banks and credit unions have strongly supported this provision, arguing that stablecoin rewards could lead to capital flight from traditional banks.
According to these institutions, such a shift would negatively affect their balance sheets, reduce deposit bases, and limit the amount of money available for lending. This clash highlights the growing tension between legacy financial institutions and the crypto industry.
White House Pushback
Adding another layer of uncertainty, the White House threatened to withdraw its support for the CLARITY Act, stating that Coinbase does not represent the entire crypto industry. Companies such as Kraken and Robinhood reportedly maintain different views, suggesting that the industry itself is not unified on the bill’s final structure.
Key Macro Catalysts to Watch
Looking ahead, several high-impact catalysts could determine the next major move for the BTC/USD pair.
Supreme Court Decision on US Tariffs
The most significant upcoming event is the U.S. Supreme Court ruling on the legality of US’s tariffs. A decision to end these tariffs would likely be bullish for Bitcoin and other risk assets.
Lower tariffs could reduce inflationary pressures, potentially giving the Federal Reserve more room to deliver interest rate cuts. Historically, lower interest rates and looser monetary policy have been extremely supportive of Bitcoin prices.
Market Structure Bill Progress
The market will also closely monitor any developments related to the Market Structure Bill in Washington. A clear signal that the bill is likely to pass would provide regulatory clarity, a factor widely viewed as bullish for Bitcoin and the broader crypto ecosystem.
BTC/USD Technical Analysis
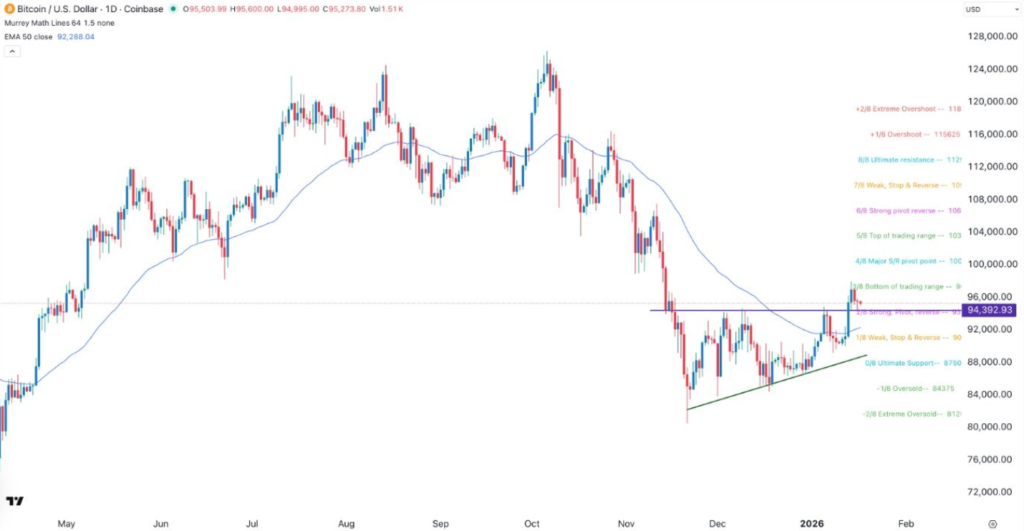
From a technical standpoint, the daily chart still leans bullish. The BTC/USD pair has seen a controlled pullback from the $98,000 peak to roughly $95,325, yet the overall price structure remains strong and constructive.
Key Technical Levels
Bitcoin is currently holding above the critical support level at $94,392, which marks the upper boundary of an ascending triangle pattern, signaling structural strength. The price has also remained above the 25-day Exponential Moving Average (EMA), reinforcing a short-term bullish trend.
Additionally, BTC has moved slightly above the strong pivot reverse level derived from the Murrey Math Lines indicator, a development that is often associated with trend continuation and sustained upward momentum.
Bullish Breakout Scenario
As long as Bitcoin remains above the ascending triangle support, the probability favors a rebound toward key resistance. The most important level to watch is the psychological and technical resistance at $100,000.
A confirmed breakout above this zone could trigger momentum-based buying, short-covering, and renewed institutional inflows, potentially opening the door to new all-time highs.
Conclusion
Despite short-term volatility driven by regulatory uncertainty and ETF outflows, the BTC/USD Forex signal remains bullish. Strong technical support, resilient institutional demand, and multiple macro catalysts suggest that Bitcoin is building energy for its next major move. If current support holds, a Bitcoin jump to $100,000 appears increasingly likely in the weeks ahead.