
Bitcoin (BTC) has once again captured the attention of investors as it rises above the $70,000 mark, gaining 3.3% in the past 24 hours. The move comes ahead of the U.S. February inflation report, which is expected to influence both macro markets and cryptocurrency sentiment.
Technical indicators and market fundamentals suggest that BTC may be preparing for its next significant rally, potentially targeting $85,000 if bullish momentum continues to build. In this article, the brokers at BlitzPine Group offer a complete analysis of the topic.
Bitcoin ETF Inflows Show Strong Market Confidence
Last week, Bitcoin exchange-traded funds (ETFs) attracted $568 million, signaling improving market sentiment among institutional and retail investors. These inflows mark a continuation of the growing confidence in BTC, especially after the recent sell-offs. ETFs saw an additional $168 million in capital inflows yesterday, further demonstrating that investors are willing to commit fresh capital at current price levels.
Meanwhile, the Crypto Fear and Greed Index climbed from a low of 5 (“panic”) to 26, reflecting a notable shift toward optimism in the market. These metrics, combined with rising ETF inflows, indicate that investors perceive the worst of the sell-off to be behind them, despite ongoing geopolitical tensions that have rattled broader markets.
Short liquidations have also surged, totaling nearly $400 million over the past three days. This rise hints at the possibility of a short squeeze, which could accelerate BTC’s ascent if the $72,000 resistance is breached.
BTC Technical Analysis: Key Resistance at $72K
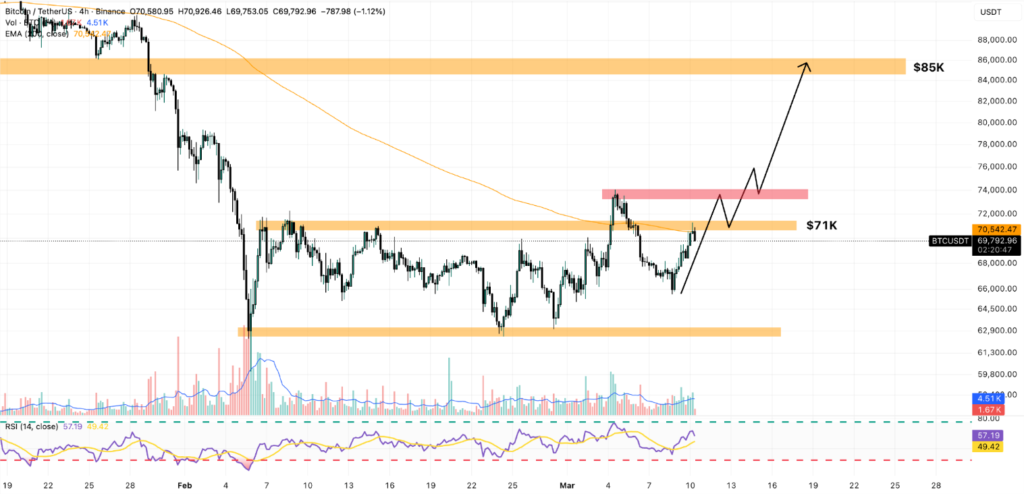
From a technical perspective, BTC is currently facing a critical resistance level at $72,000. Over the weekend, the price found strong support at $65,000, which served as a key floor. This rebound has allowed BTC to climb steadily, with trading volumes increasing by 23% over the past 24 hours, signaling mounting buying pressure.
The 4-hour chart shows BTC confined within a tight trading range, but key indicators are starting to flash bullish signals. The 21-period exponential moving average (EMA), closely monitored by our signals system, was recently breached. This event often precedes a trend reversal. Simultaneously, the Relative Strength Index (RSI) for this time frame has moved above the 14-period moving average and briefly surpassed 60, suggesting that bullish momentum is accelerating.
If BTC can break above $72,000, another short squeeze may follow, potentially leading to a strong relief rally toward $85,000. Traders should also monitor the secondary resistance level at $74,000, where previous sell walls have formed. This will be a critical zone to gauge BTC’s next directional move.
Market Catalysts: Geopolitics and Inflation
BTC’s recent recovery has been influenced not only by technical factors but also by geopolitical developments. Heightened tensions with Iran have coincided with BTC’s rebound from $65,000, underscoring the cryptocurrency’s growing role as a hedge against uncertainty.
Investors are also keeping a close eye on the U.S. February inflation report, scheduled for release tomorrow. Historically, inflation data has had a significant impact on BTC’s short-term movements. Positive surprises may accelerate the bullish breakout, while unfavorable data could trigger a retest of support levels at $65,000 or even $62,000.
Waiting for Confirmation: Signals During the American Session
Despite BTC’s upward trajectory, the market remains cautious, waiting for a clear buy or sell signal during the American trading session. On the hourly chart, there is evidence that selling pressure is beginning to mount, which could confirm a rejection of the $72,000 resistance if accompanied by a “sell” signal.
The last confirmed buy signal appeared near $70,000, but traders generally prefer signals near critical resistance levels to validate a trend continuation. A breakout above $72,000 accompanied by a new buy signal would confirm that BTC is positioned for a strong upward move, possibly toward $85,000.
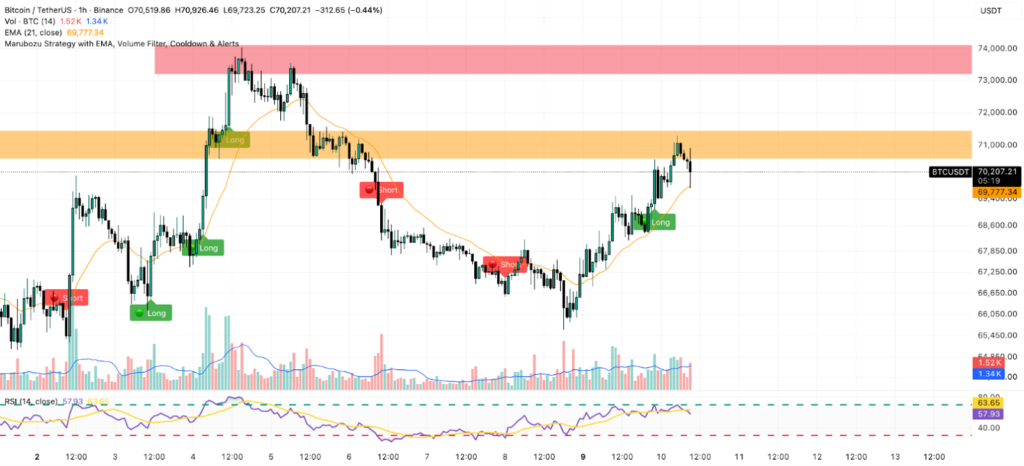
Conversely, a sell signal at or near $72,000 could create an opportunity to short sell, with a potential retracement toward $65,000, followed by $62,000 if bearish momentum strengthens.
Conclusion: BTC Eyes $85K Amid Positive Momentum
In summary, Bitcoin (BTC) is currently positioned for a potential breakout, with strong technical indicators, increasing ETF inflows, and improved market sentiment all pointing toward a bullish scenario. The $72,000 resistance remains the key hurdle. A confirmed buy signal above this level could unleash a relief rally targeting $85,000.
However, traders should remain vigilant, as the American session may provide the decisive volumes that either confirm the breakout or trigger a short-term correction. As BTC continues to navigate this critical zone, careful attention to signals, volume, and macro catalysts will be essential for positioning in the coming days.