
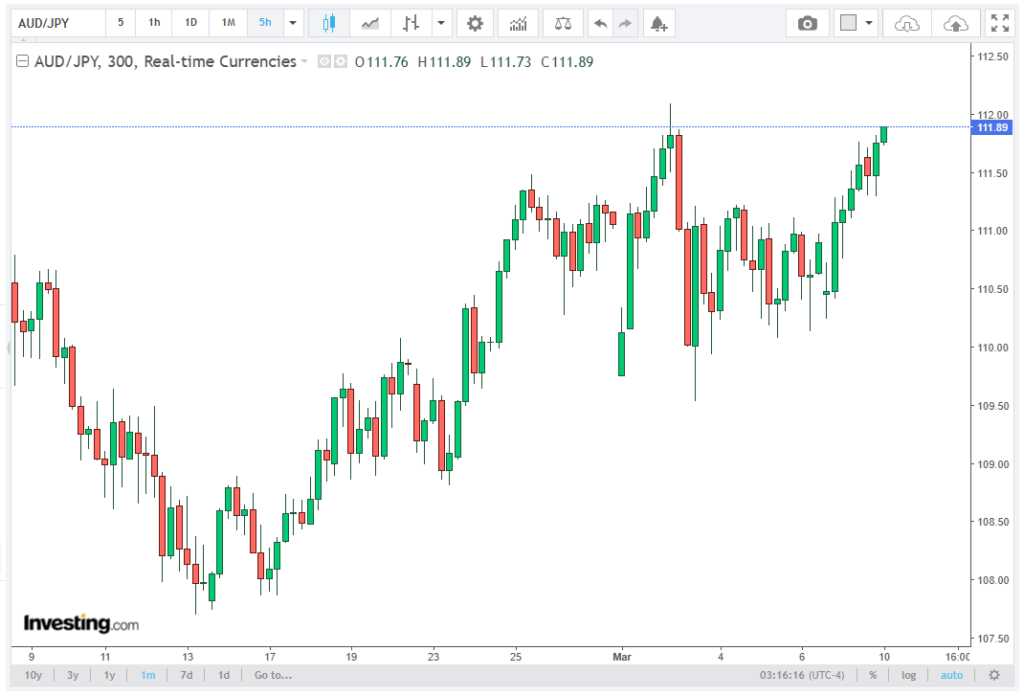
The AUD/JPY currency pair trades in positive territory near 111.80 during Tuesday’s early European session, reflecting renewed demand for the Australian Dollar (AUD) against the Japanese Yen (JPY). The pair has maintained a constructive bullish structure, supported by improving global risk sentiment and stronger regional economic signals. The topic is carefully analyzed by the brokers at TibiPro in this article.
At the time of writing, AUD/JPY hovers around 111.80, extending the upward momentum observed in recent sessions. Market participants have been encouraged by stronger-than-expected Chinese trade data, which showed a larger trade surplus at the beginning of 2026, largely driven by a sharp surge in exports.
Since China is Australia’s largest trading partner, stronger Chinese trade performance often translates into positive demand expectations for Australian commodities, thereby boosting the AUD.
Meanwhile, the Japanese Yen, traditionally viewed as a safe-haven currency, remains relatively weak amid improving risk appetite. When investors are comfortable taking on more risk, they tend to shift capital away from defensive currencies like the JPY, benefiting higher-yielding currencies such as the AUD.
As a result, the AUD/JPY cross continues to gather strength, maintaining an upward bias that is reinforced by technical indicators and macroeconomic fundamentals.
Geopolitical Risks and Safe-Haven Demand
Despite the current bullish momentum, geopolitical developments remain a critical variable for the AUD/JPY outlook. Traders are closely monitoring tensions in the Middle East, as any escalation could alter market dynamics quickly.
The Japanese Yen typically benefits during periods of geopolitical stress, as investors move toward assets perceived as safe and stable. If the regional conflict intensifies or evolves into a prolonged confrontation, the JPY could strengthen sharply, potentially creating downward pressure on AUD/JPY.
Conversely, if tensions stabilize and risk appetite improves further, carry trade strategies involving the Australian Dollar may gain popularity, encouraging investors to continue buying AUD against lower-yielding currencies like the Yen.
Therefore, while technical indicators currently support further gains, geopolitical headlines remain an important risk factor that could trigger short-term volatility in the pair.
Technical Analysis: Bullish Structure Above the 100-Day EMA
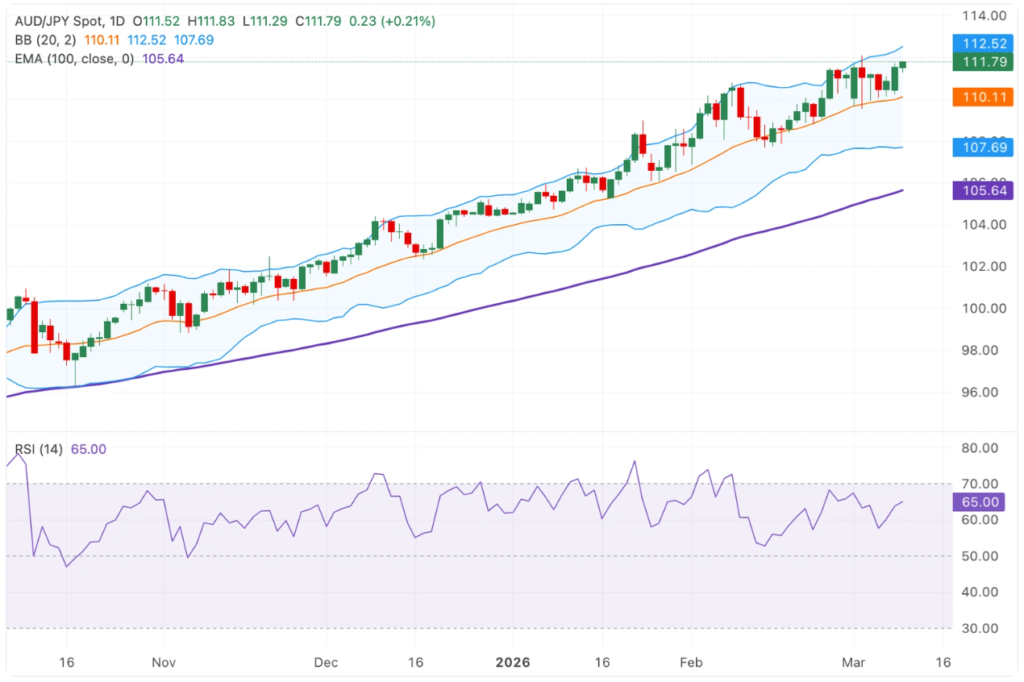
From a technical perspective, the AUD/JPY pair maintains a clearly bullish outlook. On the daily chart, the pair trades around 111.79, significantly above the rising 100-day Exponential Moving Average (EMA) located near 105.60.
Trading well above this key long-term trend indicator confirms that the current move represents a mature and sustained uptrend rather than a temporary price spike. The upward slope of the 100-day EMA further reinforces the positive medium-term momentum.
Another key signal comes from the Relative Strength Index (RSI). Currently positioned around 65, the RSI remains firmly within bullish territory but still below the overbought threshold of 70. This indicates strong buying momentum while suggesting that the pair still has room to extend gains before signs of exhaustion appear.
Additionally, the Bollinger Bands structure highlights sustained upward pressure. The AUD/JPY price holds above the middle Bollinger Band near 110.10, which typically acts as a dynamic support level during uptrends. The pair is now approaching the upper Bollinger Band near 112.50, indicating persistent bullish momentum within a widening volatility range.
Key Support Levels to Watch
In the event of a short-term correction, traders should monitor several critical support zones.
The initial support level is located near 110.10, aligning with the Bollinger middle band and a recent consolidation zone. This level is important because it represents the first layer of technical support within the current bullish structure.
Below this, the next major support area appears around 109.20, where previous range highs intersect with the lower half of the Bollinger structure. This region could act as a strong demand zone if the pair experiences moderate downside pressure.
A deeper retracement could bring the 107.70 level into focus, corresponding to the lower Bollinger Band region seen in late February. This area effectively protects the broader uptrend and guards the 100-day EMA zone near 105.60, which remains the ultimate trend-defining support level.
As long as AUD/JPY remains above the 100-day EMA, the overall technical outlook will likely remain bullish.
Outlook
Overall, the AUD/JPY pair maintains a strong bullish outlook, supported by robust technical indicators, improving macroeconomic sentiment, and favorable risk conditions. Trading well above the 100-day EMA with a bullish RSI reading suggests that upside momentum remains intact.
However, traders should remain cautious of geopolitical developments and global risk shifts, which could quickly strengthen the Japanese Yen’s safe-haven appeal.
In the near term, support at 110.10 and resistance at 112.50 will likely determine the next directional move. A break above resistance could open the path toward 114.00, while a drop below key support levels might trigger a corrective pullback within the broader uptrend.