
The USD/CAD pair remains under selling pressure on Wednesday, as a softer US Dollar (USD) offsets the impact of sliding Crude Oil prices. Spot prices hover just above the mid-1.3500s, down nearly 0.15% for the day, and remain close to a one-month low recorded on Monday.
Current technicals suggest that the pair remains vulnerable to further downside, keeping traders cautious in the near term. The brokers at BlitzPine Group provide a comprehensive breakdown of this topic in this article.
Fundamental Drivers: US Dollar and Oil Influence
The recent weakness in USD/CAD is largely influenced by the dynamics of the US Dollar and Crude Oil. The USD has attracted fresh selling interest, amid expectations that Oil prices are no longer sufficiently high to constrain the US Federal Reserve’s (Fed) capacity to cut interest rates.
Meanwhile, the Canadian Dollar (CAD) remains sensitive to commodity-linked trends, particularly Crude Oil. A downward leg in oil prices tends to undermine demand for the Loonie, creating an offsetting pressure on the USD/CAD pair. This combination of a weaker USD and sliding oil prices has been a key factor in reinforcing near-term selling pressure.
Technical Breakdown Supports Further Depreciation
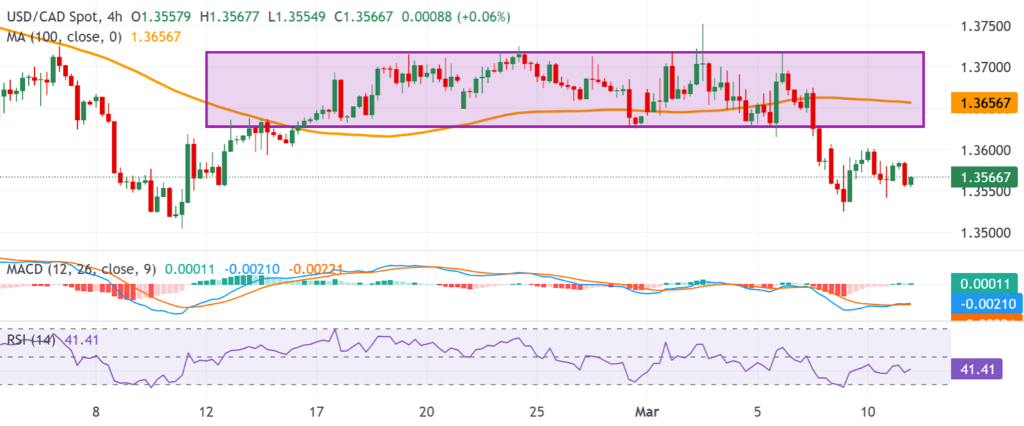
From a technical perspective, the recent breakdown through a short-term trading range support provides an important signal for USD/CAD bears. Prices have also traded below the 100-period Simple Moving Average (SMA) on the H4 chart, reinforcing the negative bias.
The Relative Strength Index (RSI) currently hovers in the low-40s, signaling a slight downside tilt rather than a fully oversold condition. This suggests that the pair still has room for further depreciation before hitting technical exhaustion.
Similarly, the Moving Average Convergence Divergence (MACD) line remains just above its Signal line, but close to the zero mark, indicating weak momentum and limited directional conviction. Despite this, the bias remains mildly bearish, particularly as the pair struggles to reclaim the descending 100-period SMA near 1.3657, which now acts as a strong resistance.
Key Support and Resistance Levels
For traders monitoring intraday moves, several technical levels stand out. The initial resistance is at 1.3600, and a break above this level could expose the 1.3657 area. This zone also aligns with the 100-period simple moving average (SMA), providing a stronger cap for price action.
A subsequent resistance level comes in at 1.3690, representing a more significant barrier. Overcoming this level would be necessary for the broader trend to shift higher and for bullish momentum to gain more conviction.
On the downside, immediate support is found at 1.3540, acting as the first line of defense for USD/CAD bulls. If this level fails to hold, the next bearish target is 1.3500, which could open the door to further downside momentum and a potential extension of selling pressure.
A sustained recovery above 1.3657 would be required to negate the current soft bearish bias and hint at a more constructive phase for the pair. Until then, the technical breakdown remains a guiding factor for traders with a short-term negative outlook.
Intraday Outlook: Mildly Bearish Bias
Through the early European session, USD/CAD continues to experience modest intraday losses, reflecting ongoing market caution amid mixed risk sentiment. The combination of a softer USD, sliding oil prices, and lackluster risk appetite continues to weigh on the pair, keeping upside attempts contained near the 100-period SMA.
Given the technical setup, traders should monitor price action closely around the 1.3560 region. A clear break below this level could trigger further downside momentum, potentially accelerating short-term selling pressure, while failure to reclaim 1.3600–1.3657 may reinforce the current bearish bias, suggesting limited upside potential and continued cautious trading conditions through the session.
Conclusion: USD/CAD Remains Technically Vulnerable
In summary, USD/CAD remains technically vulnerable near 1.3560, as a recent breakdown through support and acceptance below the 100-period SMA on H4 charts strengthens the case for further depreciation.
Key points for traders include that USD/CAD remains under selling pressure, driven by a softer USD and falling oil prices. Technical breakdowns and RSI positioning suggest there is room for additional downside, signaling that bearish momentum could continue.
The 100-period SMA on the H4 chart acts as a key resistance cap, limiting potential recovery moves and serving as a reference for traders watching for a reversal. On the downside, support levels at 1.3540 and 1.3500 are critical targets, while resistance in the 1.3600–1.3690 range defines the upside barriers that must be overcome for any meaningful bullish move.
Until USD/CAD decisively moves above 1.3657, the near-term bias remains mildly bearish, keeping traders attentive to both fundamental drivers and technical triggers.