
The Bitcoin price has staged a strong bullish rebound, pushing the BTC/USD pair to its highest level since November 14 as cryptocurrency demand accelerates across global markets.
Fueled by technical strength, regulatory optimism, and robust ETF inflows, Bitcoin is now edging closer to the psychological milestone of $100,000, a level that could define the next phase of the market cycle. FlexFlume experts deliver a detailed and insightful analysis of the subject in their latest piece.
Bitcoin Price Rebound Gains Momentum
The BTC/USD pair surged to $97,500, marking a sharp recovery from its November low of $80,465. This move reflects a renewed risk-on sentiment among investors as digital assets regain favor following months of consolidation.
Several factors are driving this rally. On the macro side, traders are positioning ahead of key regulatory developments in the United States, while on-chain and market data show growing participation from both retail and institutional investors. The rally has also coincided with strong inflows into spot Bitcoin ETFs, reinforcing confidence in Bitcoin’s medium- to long-term outlook.
BTC/USD Technical Analysis: Strong Bullish Structure
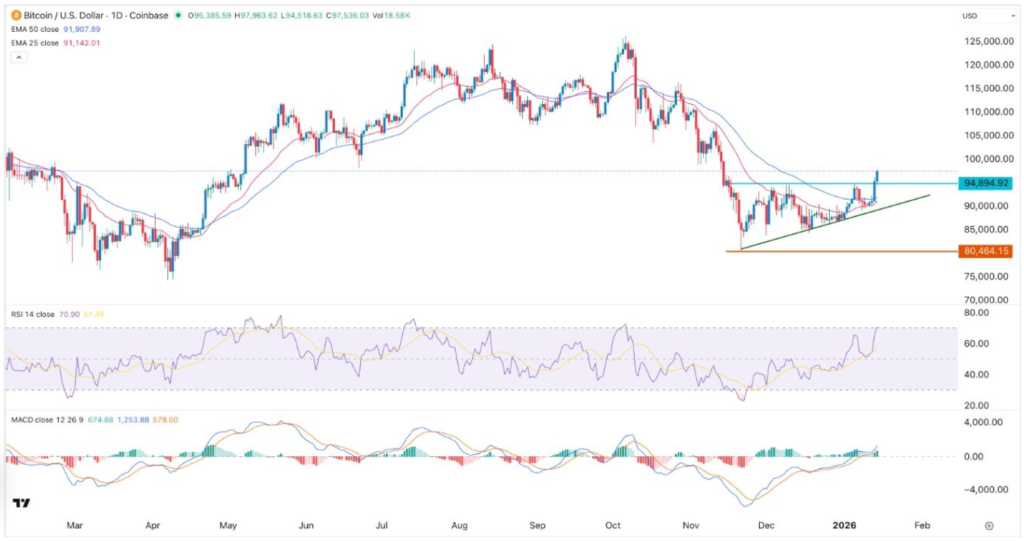
From a technical analysis perspective, the daily chart paints a compelling bullish picture. The BTC/USD pair has remained in a clear uptrend over the past few months, rising steadily from $80,465 in November to the current $97,500 level.
Breakout Above Key Resistance
One of the most significant developments has been the decisive move above the crucial resistance at $94,900, which represented the December 2024 high. This level also marked the upper boundary of an ascending triangle pattern, a widely recognized bullish continuation formation.
A breakout above this structure typically signals the resumption of an existing uptrend, and Bitcoin has so far validated this signal with strong follow-through buying.
Moving Averages and Trend Indicators
The pair has also moved above both the 25-day EMA and the 50-day EMA, confirming short-term and medium-term bullish momentum. Trading above these moving averages often attracts trend-following traders and algorithmic strategies, further supporting price gains.
Additionally, Bitcoin has flipped the Supertrend indicator into bullish territory, reinforcing the idea that the broader trend remains intact.
Momentum Indicators Confirm Strength
Momentum oscillators reinforce the bullish outlook: the RSI has rebounded sharply from an oversold level of 23 in November to around 70, signaling strong buying pressure without entering extreme overbought territory, while the MACD has crossed above the zero line with both signal lines trending higher, providing a classic confirmation of positive momentum.
Together, these indicators suggest that bulls remain firmly in control of the BTC/USD pair.
Bitcoin Targets $100,000: Key Levels to Watch
Given the current technical setup, the path of least resistance remains to the upside. Bulls are now targeting the major psychological resistance at $100,000, a level that holds both technical and emotional significance for market participants.
A clean break above $100,000 would likely open the door to further gains over time, potentially triggering momentum-driven buying, short-covering, and renewed media attention.
However, traders should also be mindful of downside risks. A drop below the key support at $94,900 would invalidate the bullish breakout and could signal a temporary pullback or consolidation phase.
CLARITY Act and Regulatory Optimism Boost Sentiment
Beyond technicals, fundamental catalysts are playing a crucial role in Bitcoin’s rally. One major driver is the upcoming markup of the CLARITY Act, scheduled for Thursday.
This proposed legislation aims to clearly define regulatory responsibilities between the Securities and Exchange Commission (SEC) and the Commodity Futures Trading Commission (CFTC). Market participants view this as a landmark regulatory step, potentially reducing uncertainty that has long weighed on the crypto sector.
If passed, the CLARITY Act would represent the most significant U.S. crypto regulatory success since the GENIUS Act, which was approved last year. Increased regulatory clarity often encourages institutional adoption, a critical ingredient for sustained price appreciation.
ETF Inflows and Institutional Demand Drive Bitcoin Higher
Another powerful tailwind for the BTC/USD pair has been strong ETF inflows. Since the beginning of the year, Bitcoin ETFs have attracted over $1 billion in net inflows, highlighting growing demand from U.S. retail and institutional investors.
Cumulatively, these ETFs now boast $57.2 billion in net inflows and manage approximately $123 billion in assets, underscoring Bitcoin’s evolution into a mainstream investment vehicle.
This steady inflow of capital provides structural support for Bitcoin prices and reduces the likelihood of prolonged drawdowns.
Outlook: Bullish Bias Remains Intact
In summary, the BTC/USD forex signal remains bullish, supported by strong technical indicators, regulatory optimism, robust ETF inflows, and favorable macro-political expectations. As long as Bitcoin holds above $94,900, the outlook favors a continued advance toward, and potentially beyond, the $100,000 milestone.